- May 11, 2021
- Posted by: Shane Daly
- Category: Trading Article
Using everything from price action and volume, to technical indicators and news, there are many ways to piece together a trading strategy that could be viable.
In this article, I am going to show you how to use the following moving averages to design a trading system:
- 10 period SMA (simple moving average)
- 20 period SMA
- 200 period SMA
What we have are two short term averages that are good for swing traders and the longer term trend following 200 period moving average.
 Using this combination will give all us the advantage of trading the shorter term moves in the context of the longer term trend.
If you are interested in how to use one moving average plus price action, read my article on the daily time frame trading strategy.
10/20/200 Trading Strategy
I won’t go into detail about the calculation of the SMA but if interested, you can see two other simple moving average strategies here.
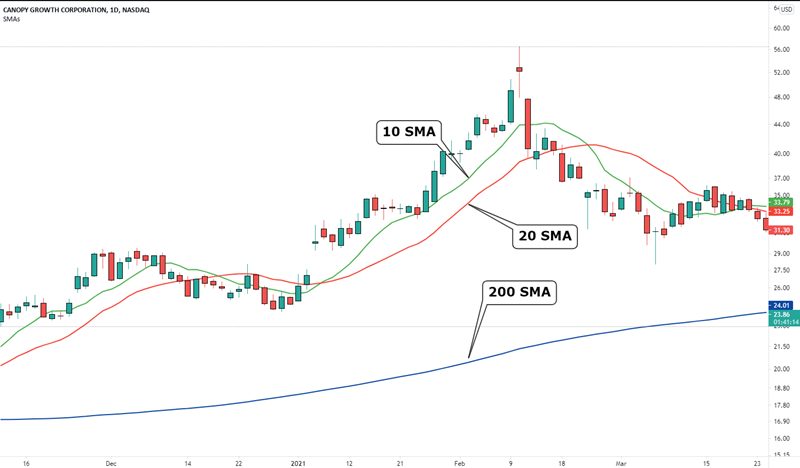
The top level view of the 10/20/200 is:
- When the 10 crosses the 20, you are seeing a change in the shorter term trend in the instrument
- The 200 SMA is the indicator in control giving you the longer term trend
- We would prefer taking trades in the direction of the overall trend
- We can take counter trend trades as long as we are keeping expectations in check
Entering trading positions is just one part of the trade.
You will also need to find a way to exit as well as ensure you are following good risk protocols for each trade.
Let’s explore several approaches as well as the good and the bad about each.
10/20/200 Crossover
The first thing a new trader must come to terms with is that moving averages lag the market. Expecting to catch bottoms and tops is unrealistic when using derivatives of price but the meat of the move is often the cleanest price move.
With this crossover:
- Price above the 200 SMA, long trades are with trend
- Price above the 200 SMA, shorts are against the trend
Keep in mind that it is fine to trade short term corrections against the main trend. Just realize that the odds are that the main trend direction will assert itself eventually.
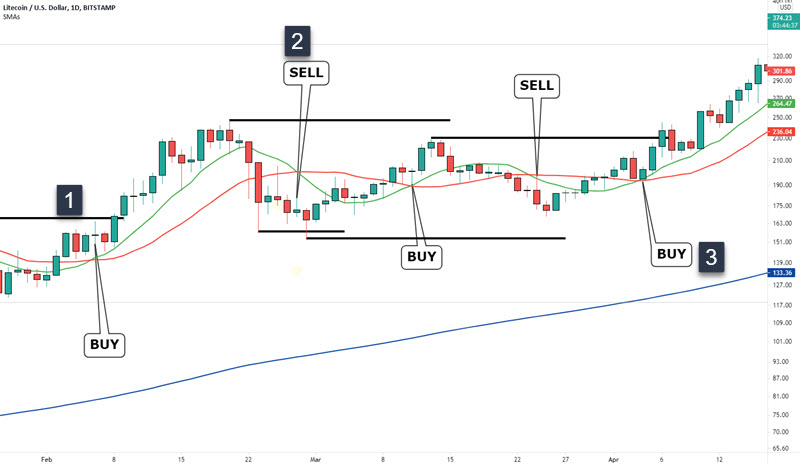
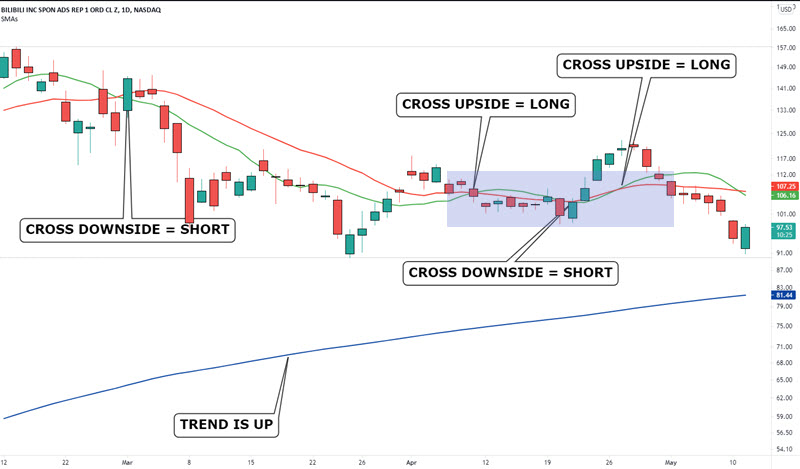 I intentionally picked a non-perfect daily chart since it’s very easy to cherry pick the best setups.
In this example, the overall trend is up as shown by the blue line (200 SMA). Depending on your entry, the first short does very well.
When we try to get back to the upside with the crossovers, we are in a choppy market as shown by the blue rectangle.
You can fully expect this when using just using a crossover of the 10/20 SMA as a trade entry.
How Can We Improve the 10/20/200 SMA Crossover Strategy?
There are slight improvement we can make such as using buy or sell stop orders.
Using that technique, you would simply place your order to enter the market after the cross using a pending order.
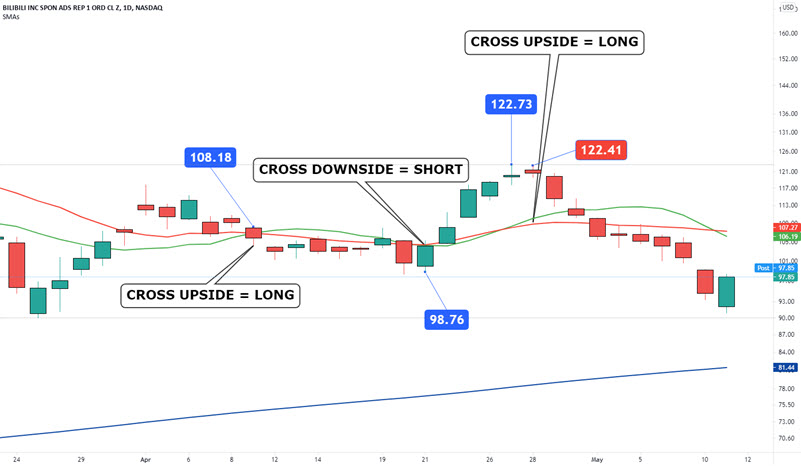 I zeroed in on the choppy section and used the actual price points so you can see how this works.
108.18 – This is the high price of the candle that closed when the cross occurred. Price never breaks the high before another cross to the downside
98.76 – Price low for the short trigger that never happens
122.73 – This would be the high price of the candle where the cross occurs. Notice that the next candle does not break that price level.
Just by using a pending order to ensure price is moving in your direction, you are not in any of this choppy price action.
Breaks of Swing Points
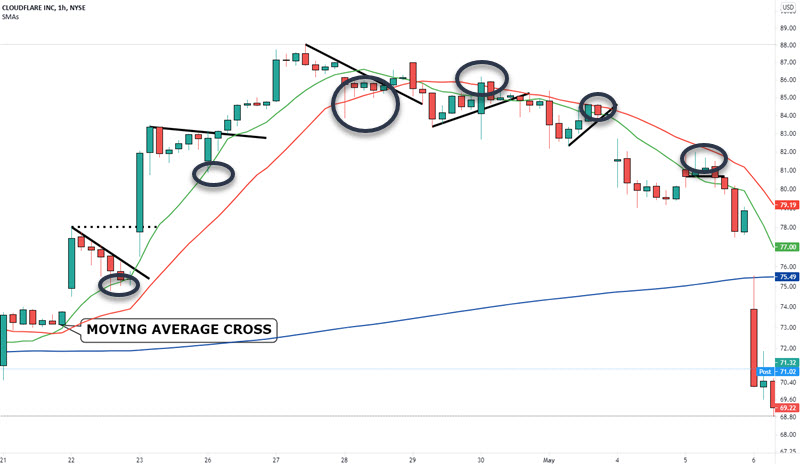
Another way to improve the crossover method of trading is to make sure price is breaking swing points.
A trending structure of higher highs/lows (uptrend) and lower high/lows (downtrend) requires breaks of those high/lows.
We can use that after the crossovers as an added confirmation that price is heading, at least in the short term, in the right direction.
We have 3 trades out of 5 potential ones that actually trigger a trade. Trade number 2 barely broke the previous swing point but it did and that matters when deciding on a trading strategy.
Before moving on, there is another point the is vital and that is the state of the 200 SMA.
Slope of the 200
In the last example, the blue line is clearly sloping upwards which is a strong sign that the longer term uptrend is intact.
As part of your trading strategy, you may want to include sitting out counter trend trades when the longer term 200 SMA is obviously against you. You won’t avoid all losing trades, it’s impossible to do that, but you can reduce them when faced with such an obvious trend direction.
Zones Of Opportunity
This is a different approach than the crossover method.
We could say that the first strategy was more of a momentum breakout type of strategy. We were getting involved when price movements were large enough to cross the averages. When price extends, we start to face exhaustion risk.
Exhaustion risk means that price has been traveling in one direction for a period of time. We expect traders to take profits at some point or counter trend traders to step in.
The “Zones Of Opportunity” approach with the 10/20/200 SMA is looking for pauses in price advancement and trading the reversal.
Before I continue, note that I don’t buy into the “dynamic support and resistance” function of moving averages. It’s a mathematical calculation of an average price over N periods and at times, the average will catch up to price or a sharp move will drive price to the average.
It’s just an illusion that the average is supporting price.
 All we want to see here is the shorter moving averages confirming the trend direction of the longer term average.
We then want to see price pull back to or inside the averages.
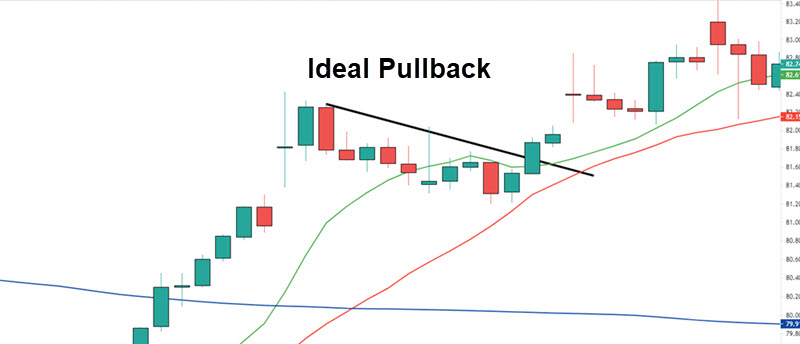
This image is a good example of the type of pullback I like.
- There is not a lot of momentum during the pullback
- I can draw a proper trendline as there is a middle point
- This is actually a two legged pullback (complex correction). This is made clear by the high in the middle of the pullback
Using various tools such as trend line breaks, breaks of highs, and even candlestick reversals, we enter the trade in the direction of the trend.
Counter Trend Trading
When taking those trades, just watch for any momentum moves in the opposite direction of the shorter term trend.
To ensure you don’t take a bigger than anticipated loss on those, if price is breaking the last pivot high in a short term downtrend, you would want to exit the trade.
For many traders, just sticking with the trend trades is the safer bet. There will always be an instrument that lines up strongly in the direction of the dominant trend.
Stop Loss And Targets
My “goto” stop loss has always been the average true range method. Using the volatility of the market has always made good sense to me and I have found it to be fairly reliable.
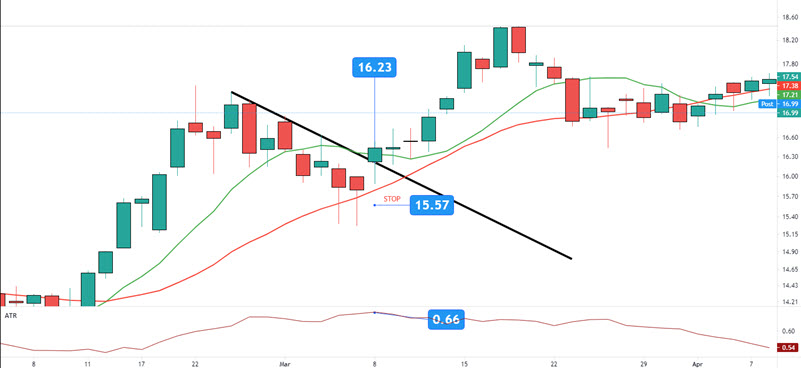
This is a daily chart and price has pulled back into our zone of opportunity.
- Trade entry price of 16.23
- ATR reading is .66
- For simplicity, we are using 1XATR. 16.23-.66= our stop loss at 15.57
You would place your stop as soon as you are in the trade.
Profit Targets
Every trader is different. Some will trail their stop looking to make big gains. You can use the 10 SMA or 20 SMA, or any number of trailing stop techniques.
To keep it simple, you may consider a simple scaling out approach:
- 1/3 off at 1 times your risk
- 1/3 off at 2 times risk
- The final portion out at 3 x risk
Every trader will have their own tolerance for profit taking. There is no cookie cutter approach and above all, you have to be comfortable with your method.
Conclusion
Both of these methods can be built upon and each has their own merits.
For my money, I prefer pullback trades using zones of opportunities. These aren’t magic but they give a zone where you can look for reversals. You should keep in mind that pullbacks that have strong momentum are not the best candidates to trade.
I like to see a lazy pullback where no candlestick vastly outsizes the others. This tells me there was not a lot of profit taking and that the other side is not putting up a fight.
There are other combinations of moving averages traders can use such as the “Golden Cross” settings. That should tell you that there is no right ones to use.
There is a lot of bashing about moving averages but in my opinion, use them as a tool and let price lead the way.