
- March 10, 2026
- Posted by: Shane Daly
- Categories: Advanced Trading Strategies, Trading Article

If you’re trading off a single chart, you’re flying blind. Smart traders don’t guess—they confirm. They layer timeframes, filtering noise and exposing high-probability setups that most retail traders never see. The difference between a winning trade and a costly one often comes down to one overlooked step in your analysis. What follows will change how you approach every chart you open.
The Executive Summary
- Smart traders use a top-down approach, analyzing higher timeframes first to identify trends before drilling down for precise entries.
- Three timeframes — Context, Setup, and Trigger — work together to confirm setups and filter out low-probability trades.
- Confluence across multiple timeframes reduces false breakouts and whipsaws, significantly improving trade accuracy and confidence.
- Timeframe combinations vary by style: swing traders use Weekly/Daily/4-Hour, while scalpers rely on 15-Minute/5-Minute/1-Minute charts.
- When timeframes conflict, smart traders prioritize the higher timeframe signal or stay out entirely to preserve their edge.
The Top-Down Advantage: Why One Chart is a Retail Trap
When you rely on a single chart, you’re not trading — you’re guessing with incomplete information. Retail traders consistently ignore timeframe hierarchy, executing 5-minute signals without understanding broader market context. That “perfect” bullish engulfing candle means nothing if the Daily trend is aggressively bearish.

Smart traders apply trend alignment through a top-down approach — analyzing higher timeframes first, then drilling down. This signal validation process filters out low-probability setups before they damage your account. It also strengthens trade psychology; you’re no longer second-guessing entries when every timeframe confirms your bias.
Timeframe synergy also improves volatility assessment, helping you anticipate momentum changes rather than react to them which generally results in a FOMO trade. Most important, it transforms your risk management — because when higher timeframes act as gravitational pull, you stop fighting the market and start flowing with it.

Defining the Trio: Context, Setup, and Trigger Timeframes
Professional traders don’t operate off a single timeframe — they stack three distinct layers into a structured hierarchy: the Context, the Setup, and the Trigger.

The context definition starts at the highest timeframe. This layer handles your core market analysis, confirming whether the trend justifies a directional (trend) bias. It fundamentally grants or denies trading permission as you want to trade an instrument that does have some direction either up or down.

The setup importance lives in the middle timeframe. Here, you’re looking for trades — identifying key support/resistance zones, supply/demand imbalances, and technical indicators like moving average clusters. This layer sharpens your situational awareness.
The trigger patterns operate at the lowest timeframe. Once price enters a setup zone with proper timeframe alignment to the direction frame, you execute based on specific setups — pin bars, breakouts – anything that shows the higher timeframes are taking control.
Timeframe overlap is what separates precision from guesswork. When all three layers agree, your trading psychology stabilizes because your entries carry structural confirmation, not impulsive trading acts.
The Power of Confluence: When the “Tide” and “Ripple” Align
Confluence isn’t just a buzzword — it’s the structural edge that separates high-probability setups from noise. When your three timeframes align, you’ve achieved timeframe alignment— a condition where every layer of the market reinforces the same directional bias.
Think of it this way: the Daily trend is your Tide, the 1-Hour structure is your Wave, and the 5-Minute signal is your Ripple. When all three push in the same direction, you’ve activated momentum synergy. That alignment — what traders call “Triple Confluence” — dramatically reduces whipsaws and false breakouts.
The confluence significance here is measurable. You’re not guessing; you’re confirming. Each timeframe filters out weak setups, leaving only high-conviction entries.
That’s trading precision in action — not reacting to noise, but responding to coordinated market agreement across every relevant timeframe you’re monitoring.
Selecting Your Trio: Proven Timeframe Combinations for Every Style
Three timeframe combinations define the core of disciplined trading, and choosing the right set depends entirely on your style and tempo. Each trio maintains a factor of four to six between charts, ensuring time alignment without cognitive gaps.
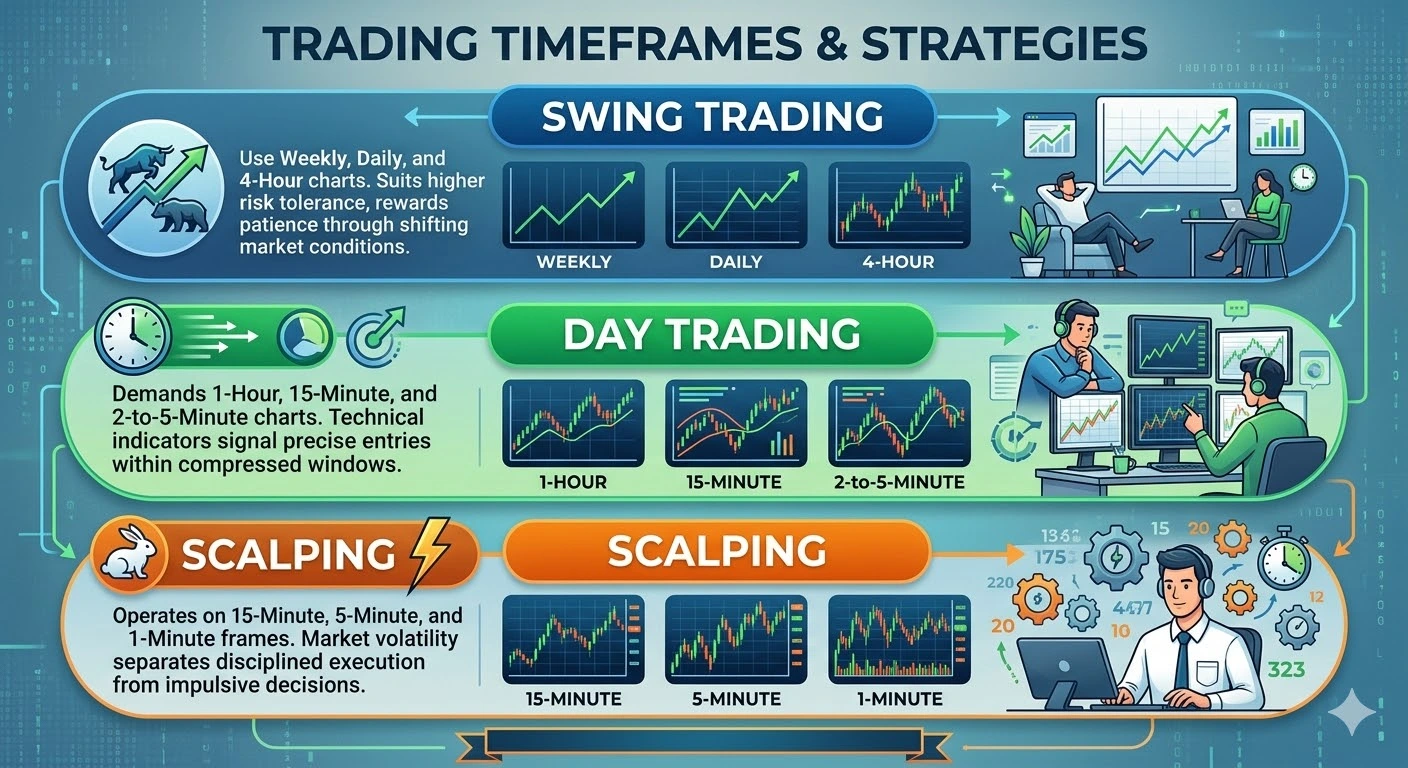
For swing trading, you’ll use Weekly, Daily, and 4-Hour charts. This structure suits higher risk tolerance and rewards patience through shifting market conditions.
Day trading demands 1-Hour, 15-Minute, and 2-to-5-Minute charts, where technical indicators signal precise entries within compressed windows.
Scalpers operate on 15-Minute, 5-Minute, and 1-Minute frames, where market volatility separates disciplined execution from impulsive decisions.
Your timeframe selection directly shapes your trading psychology. Mismatched charts create conflicting signals, distorting your personal strategy and degrading performance analysis.
Before committing to any timeframe alignment, run backtesting strategies across each combination. Let data, not preference, confirm which structure genuinely aligns with your execution style and decision-making pace.
Risk Compression: Using Lower Timeframes to Explode Your R:R
Once you’ve locked in the right timeframe trio for your style, you can weaponize that structure to dramatically improve your R:R on every trade. This is where timeframe synergy transforms your risk management from passive to surgical.
Here’s the idea: your higher timeframe handles trend identification and profit scaling, while your lower timeframe delivers entry at the best possible time. A standard 4-hour setup might carry a pretty heavy stop loss.

Drop to the 5-minute chart for volatility assessment and market analysis, and you’ll often locate an exact structural turning point requiring only a smaller stop.
That compression is everything. Your profit target stays anchored to the 4-hour structure, but your risk shrinks by 80%. Your stop loss strategies tighten without compromising the trade’s logic.
You’re not changing the trade — you’re refining its geometry. Same dollar risk, dramatically higher reward. That’s precision compounding your edge systematically.
Overcoming Conflict: What to Do When Timeframes Disagree
Even with a well-structured timeframe trio, conflict between timeframes is inevitable — and how you handle it separates disciplined traders from knee-jerk ones.
When timeframe alignment breaks down, your decision making clarity depends on one rule: the higher timeframe always wins.
If your daily chart signals bullish market sentiment but your 1-hour chart looks bearish, that’s not a short signal — it’s a pullback. You’re looking for a buying zone, not a reversal. This approach reinforces trend confirmation and maintains analysis consistency across your entire framework.
Smart conflict resolution means reframing lower timeframe weakness as opportunity, not contradiction. Use it for refined entries, not strategy adaptation that abandons your directional bias.
However, when structure is genuinely messy and signal validation is impossible across timeframes, you stay out. Cash is a position. Forcing trades in conflicted conditions destroys your edge — and disciplined inaction is still a decision.
The Smart Trader’s Workflow: A Step-by-Step Execution Checklist
Start your market analysis by identifying your HTF bias — your context direction. Only trade with it, never against it.
Next, apply execution discipline by drawing your setup zone on the MTF. Wait for price to touch one before considering any entry strategies.
Once price enters your zone, confirm your trigger on the LTF using a specific candle pattern or indicator signal.
For risk management, place your stop-loss using LTF structure to compress your risk exposure.
Finally, target MTF or HTF levels for your exit.
This workflow demands strategy adaptation as conditions evolve, but the framework stays fixed.
Follow each step sequentially — skip none and ensure you remain disciplined.
The Knowledge Gap
Can Multiple Timeframe Analysis Work Effectively in Cryptocurrency Markets?
Yes, multiple timeframe analysis works effectively in crypto markets.
You’ll find that combining higher timeframes for trend identification with lower timeframes for precise entries sharpens your edge considerably.
Crypto’s volatility actually makes this approach more valuable, not less.
You’re able to filter out noise, confirm momentum changes, and strengthen your risk management by setting tighter stops aligned with the dominant trend structure across all timeframes.
How Does Multiple Timeframe Analysis Differ Between Stocks and Forex?
When analyzing stocks, you’ll encounter higher volatility spikes tied to earnings and sector news, requiring you to monitor daily and weekly timeframes more closely.
With forex liquidity driving smoother price action 24 hours a day, you’ll rely on shorter intraday timeframes with decent success.
Stocks force you to track individual company catalysts, while forex requires you to align your timeframes with major trading session overlaps for ideal entry signals.
Does Automated Trading Software Support Multiple Timeframe Analysis Strategies?
Yes, most modern automated trading software supports multiple timeframe analysis strategies.
You can program automated strategies to scan higher timeframes for trend direction while executing entries on lower timeframes. Timeframe synchronization is the critical component—your algorithm must correctly align signals across different periods before triggering a trade.
Platforms like MetaTrader, NinjaTrader, and TradeStation give you built-in tools to code and backtest these multi-timeframe conditions efficiently.
How Long Does It Take to Master Multiple Timeframe Trading Analysis?
Mastering multiple timeframe analysis typically takes one to three years of consistent practice, depending on your dedication and prior experience.
You’ll need to understand how different trading strategies align across timeframes, recognize patterns, and develop disciplined decision-making.
Your mastery timeline accelerates considerably when you combine structured learning with live market exposure, journaling your trades, and refining your approach through both successes and failures.
Can Multiple Timeframe Analysis Be Applied Successfully to Options Trading?
Yes, you can successfully apply multiple timeframe analysis to options trading.
Timeframes relevance becomes critical when you’re selecting expiration dates and structuring options strategies. You’ll use longer timeframes to identify dominant trends, while shorter timeframes help you pinpoint precise entry timing.
This layered approach sharpens your strike price selection, improves premium management, and greatly increases your probability of aligning trades with the market’s actual directional momentum.
Next Move
You’ve now got the full picture. Stop relying on a single chart—it’s a retail trap that distorts context and kills your edge. By aligning your anchor, context, and trigger timeframes, you’ll filter weak setups, tighten entries, and compress risk dramatically. When timeframes disagree, you wait. When they align, you strike with conviction. That’s not luck—that’s a systematic, high-probability approach that separates disciplined traders from the crowd consistently losing capital.