- April 25, 2025
- Posted by: CoachMike
- Category: Trading Article

We’re entering a critical period as major tech companies prepare to release their earnings reports. This timing often brings increased market volatility, which can feel overwhelming for many traders. While some see volatility as a threat, it actually presents unique opportunities for those who are well-prepared.
Quick Overview
- Monitor volume patterns during price movements, as reduced volume during rallies may signal potential market weakness ahead of earnings.
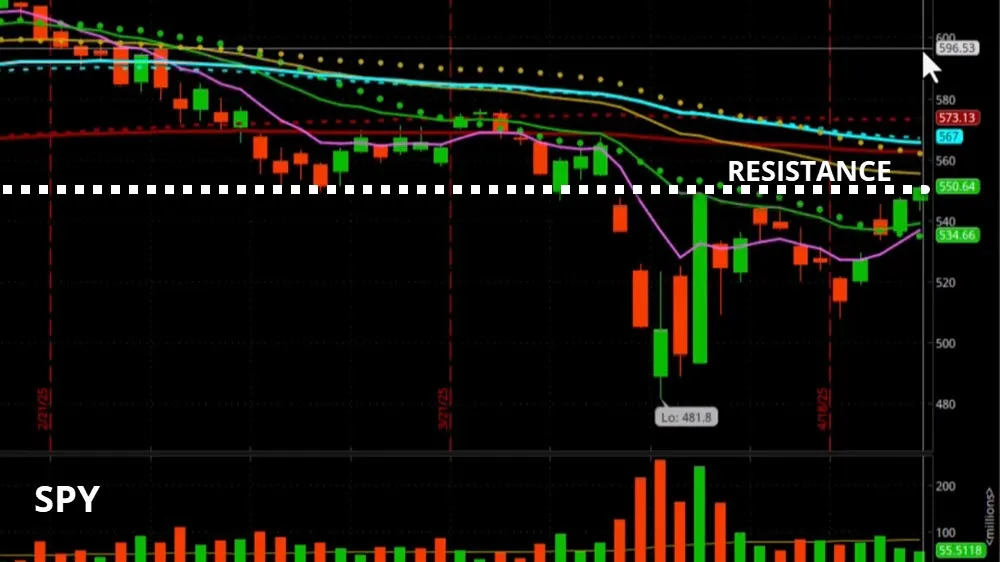
- Set clear stop-losses and take-profit levels based on key technical levels like SPY’s resistance at 555.50.
- Maintain smaller position sizes during earnings season to protect against unexpected market reactions to tech company reports.
- Use market volatility indicators like VIX to gauge sentiment and adjust trading strategies accordingly.
- Focus on strong support zones (like 539.15-534.60 for SPY) as potential entry points if market experiences earnings-related pullbacks.
While market volatility can feel overwhelming at times, we’re seeing some positive signs in the current environment. The SPY has closed above 550, marking an impressive climb from recent lows near 508. We’re particularly encouraged by the market’s resilience, even as we prepare for a week of major tech earnings announcements.
Let’s talk about what’s working in our favor right now. We’ve successfully executed a long setup that entered at 533.45 and hit our first target of 547.34, giving us a solid 45% return in just two days. This win has allowed us to reduce our risk and position ourselves for what’s coming next.

We’re keeping our eyes on the 555.50 resistance level, which could be a key indicator for future movement.
The current market dynamics present both opportunities and challenges. While the volume has been contracting during the recent price increase, with only 55 million shares traded on SPY today, we’re seeing the VIX settle at 25, suggesting decreased volatility compared to recent highs. This might give us some breathing room as we navigate through upcoming earnings reports from tech giants like Apple, Amazon, and Microsoft.
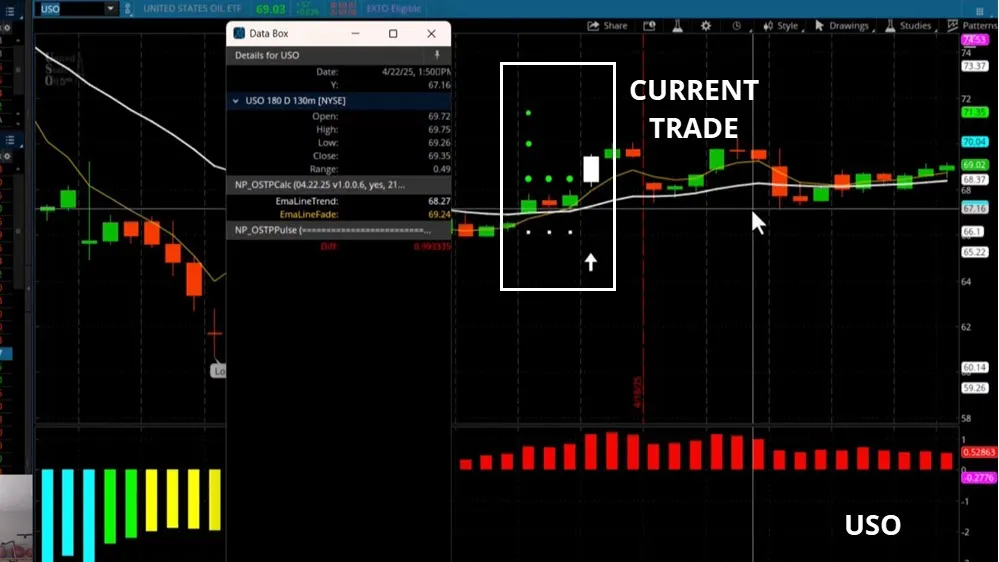
We’re also tracking interesting developments in the oil sector, with our USO trade entering at 68.47. The setup looks promising, with clear targets at 71.02 and 71.35. It’s showing signs of a coiled spring pattern, which often precedes significant movement.

We’ve positioned our stop-loss at 66.10 to protect our downside.
As we look ahead to next week, we’re maintaining a cautiously optimistic outlook. The key will be staying flexible and ready to adapt our strategies based on how the market responds to tech earnings.
We’ve identified a strong support cluster between 539.15 and 534.60, which should provide some stability. Remember, successful trading isn’t about predicting the future – it’s about having a clear plan and being ready to adjust when market conditions change.
Your Questions Answered
How Do International Markets Affect Spy’s Performance During Major Tech Earnings?
We watch Asian and European markets closely during tech earnings, as their reactions to major announcements often impact SPY’s opening price and trading momentum throughout our sessions.
What Role Does Options Trading Volume Play in Predicting Market Direction?
We watch options trading volume as a key sentiment indicator. When calls outpace puts significantly, it often signals bullish momentum, while heavy put volume suggests potential downside movement.
How Do Retail Investors Impact Market Volatility Compared to Institutional Traders?
We’ve seen retail investors create short-term volatility spikes through coordinated actions, but institutional traders still dominate overall market direction with their larger capital base and sophisticated trading strategies.
When Should Traders Switch From Technical Analysis to Fundamental Market Indicators?
We should combine both analyses constantly, but switch to fundamentals during major economic releases, earnings seasons, and significant policy changes that override short-term technical patterns.
What Correlation Exists Between VIX Levels and Successful Swing Trading Strategies?
We’ve found VIX levels above 25 provide better swing trading opportunities, while lower VIX readings suggest tighter ranges. We’ll typically look for breakout trades when volatility expands beyond historical norms.

