

- July 23, 2025
- Posted by: Shane Daly
- Categories: Trading Article, Trading Indicators

You’ve maybe heard that Bollinger Bands are almost the perfect trading indicator, but don’t fall for this common trap. While these bands can be powerful tools for analyzing market volatility and trends, they aren’t magical profit generators. Many traders lose money by following oversimplified rules about buying at the lower band and selling at the upper band. There’s much more to understanding how these indicators work, and you’ll want to know the real story behind their effectiveness.
Video Highlights
- Blindly buying at lower bands and selling at upper bands is a losing strategy, as bands indicate volatility rather than guaranteed reversals.
- Bollinger Band squeezes don’t always lead to breakouts – confirmation through volume and price action is essential.
- Price touching the upper band doesn’t automatically signal overbought conditions, especially during strong upward trends.
- Trading against the trend when price walks along bands is dangerous, as this pattern typically indicates trend strength.
- Position sizing should adapt to band behavior, with smaller positions during squeezes and larger ones during confirmed trends.
The Truth Behind Common Bollinger Band Trading Myths
While many traders swear by the classic “sell at the upper band, buy at the lower band” strategy, this oversimplified approach often leads to costly mistakes.
The biggest Bollinger Misapplication comes from ignoring market momentum and fighting strong trends. Your Trading Psychology might tell you to sell when prices hit the upper band, but in strong uptrends, this can be a recipe for losses.
Instead of automatically betting against the market, you’ll want to understand what the bands are really telling you about volatility and trend strength.
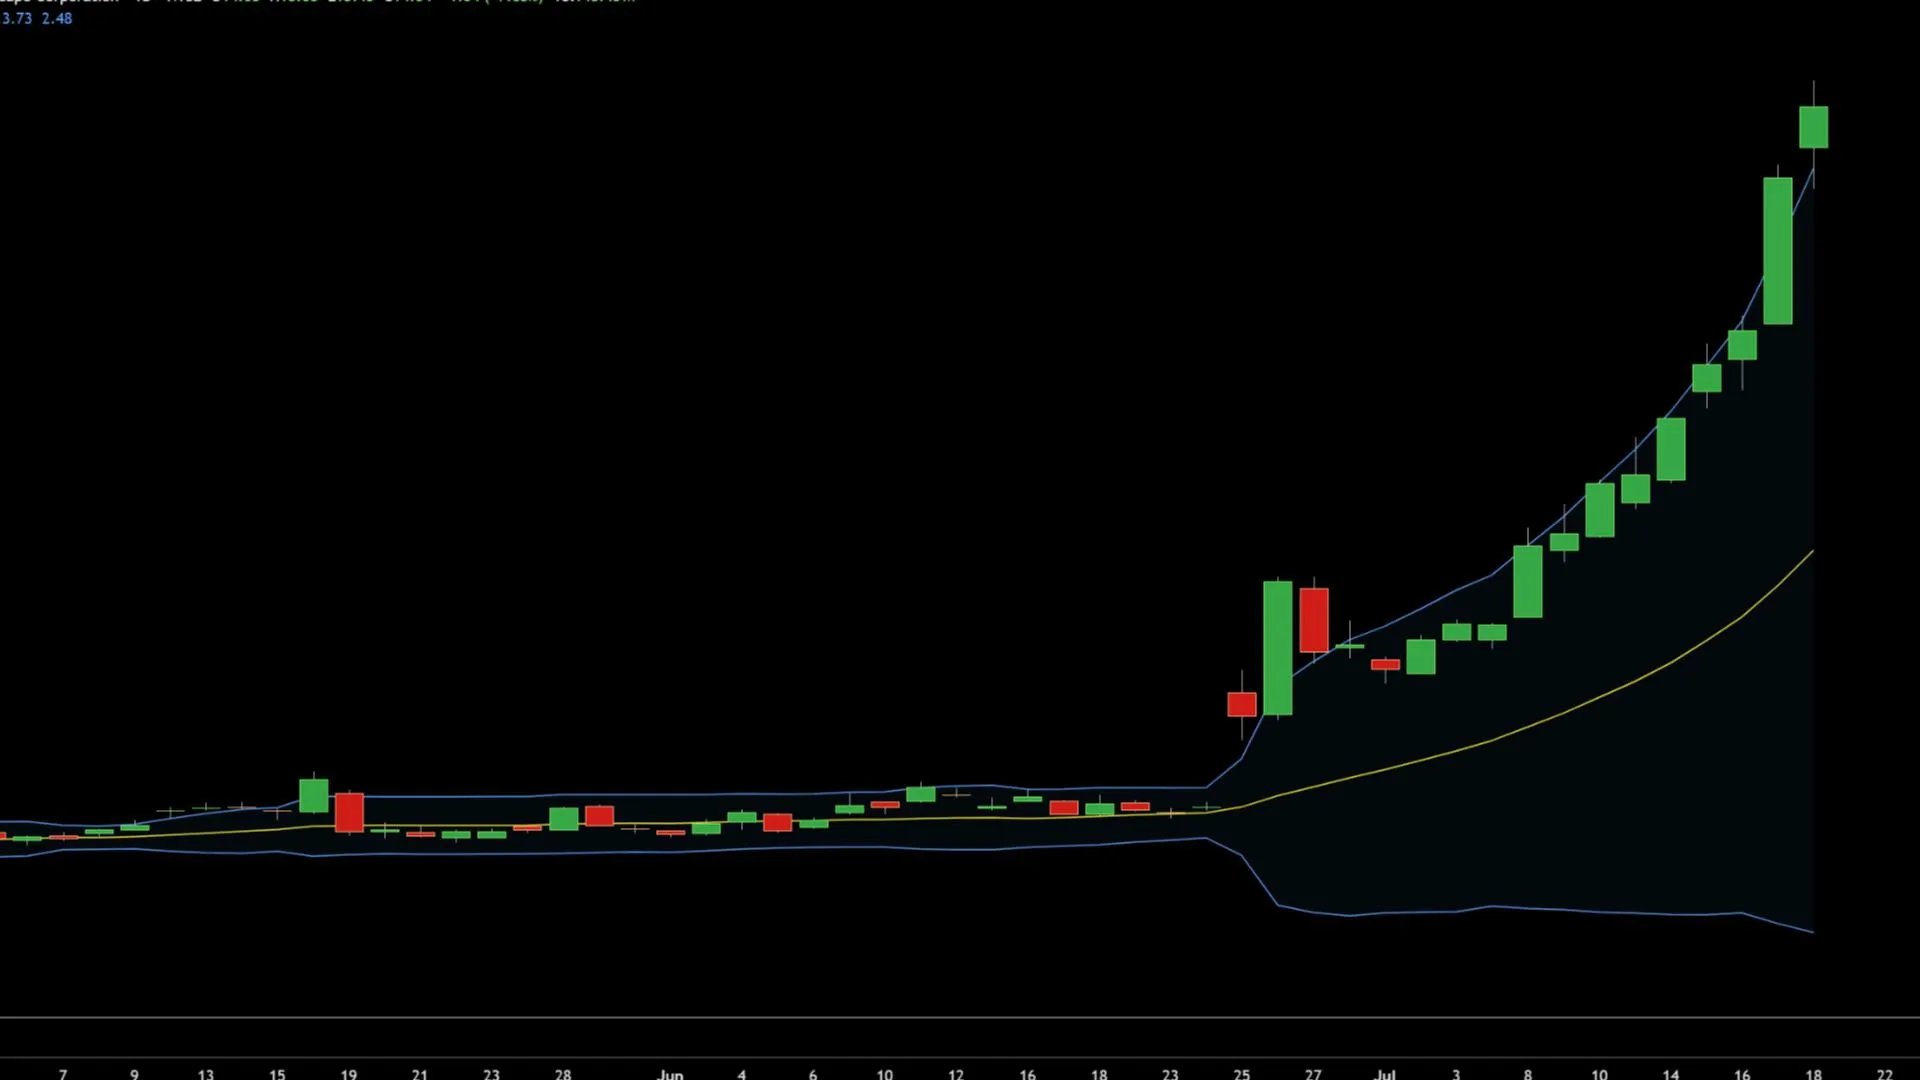
Understanding Band Squeezes and Market Momentum
When Bollinger Bands squeeze together, you’re getting a clear signal that market volatility is dropping and a big move could be coming.
This squeeze pattern is one of the most reliable indicators of an upcoming price breakout. You’ll notice the bands getting tighter and closer together as volatility decreases.
Don’t just jump in when you see band volatility shrinking.
Wait for confirmation of the breakout direction. Look for a strong price move beyond the bands, backed by increased trading volume.
The squeeze work best when you combine with other technical tools to confirm your trading decisions. You can also look for higher volume on the break as well as candlesticks that close on their highs.
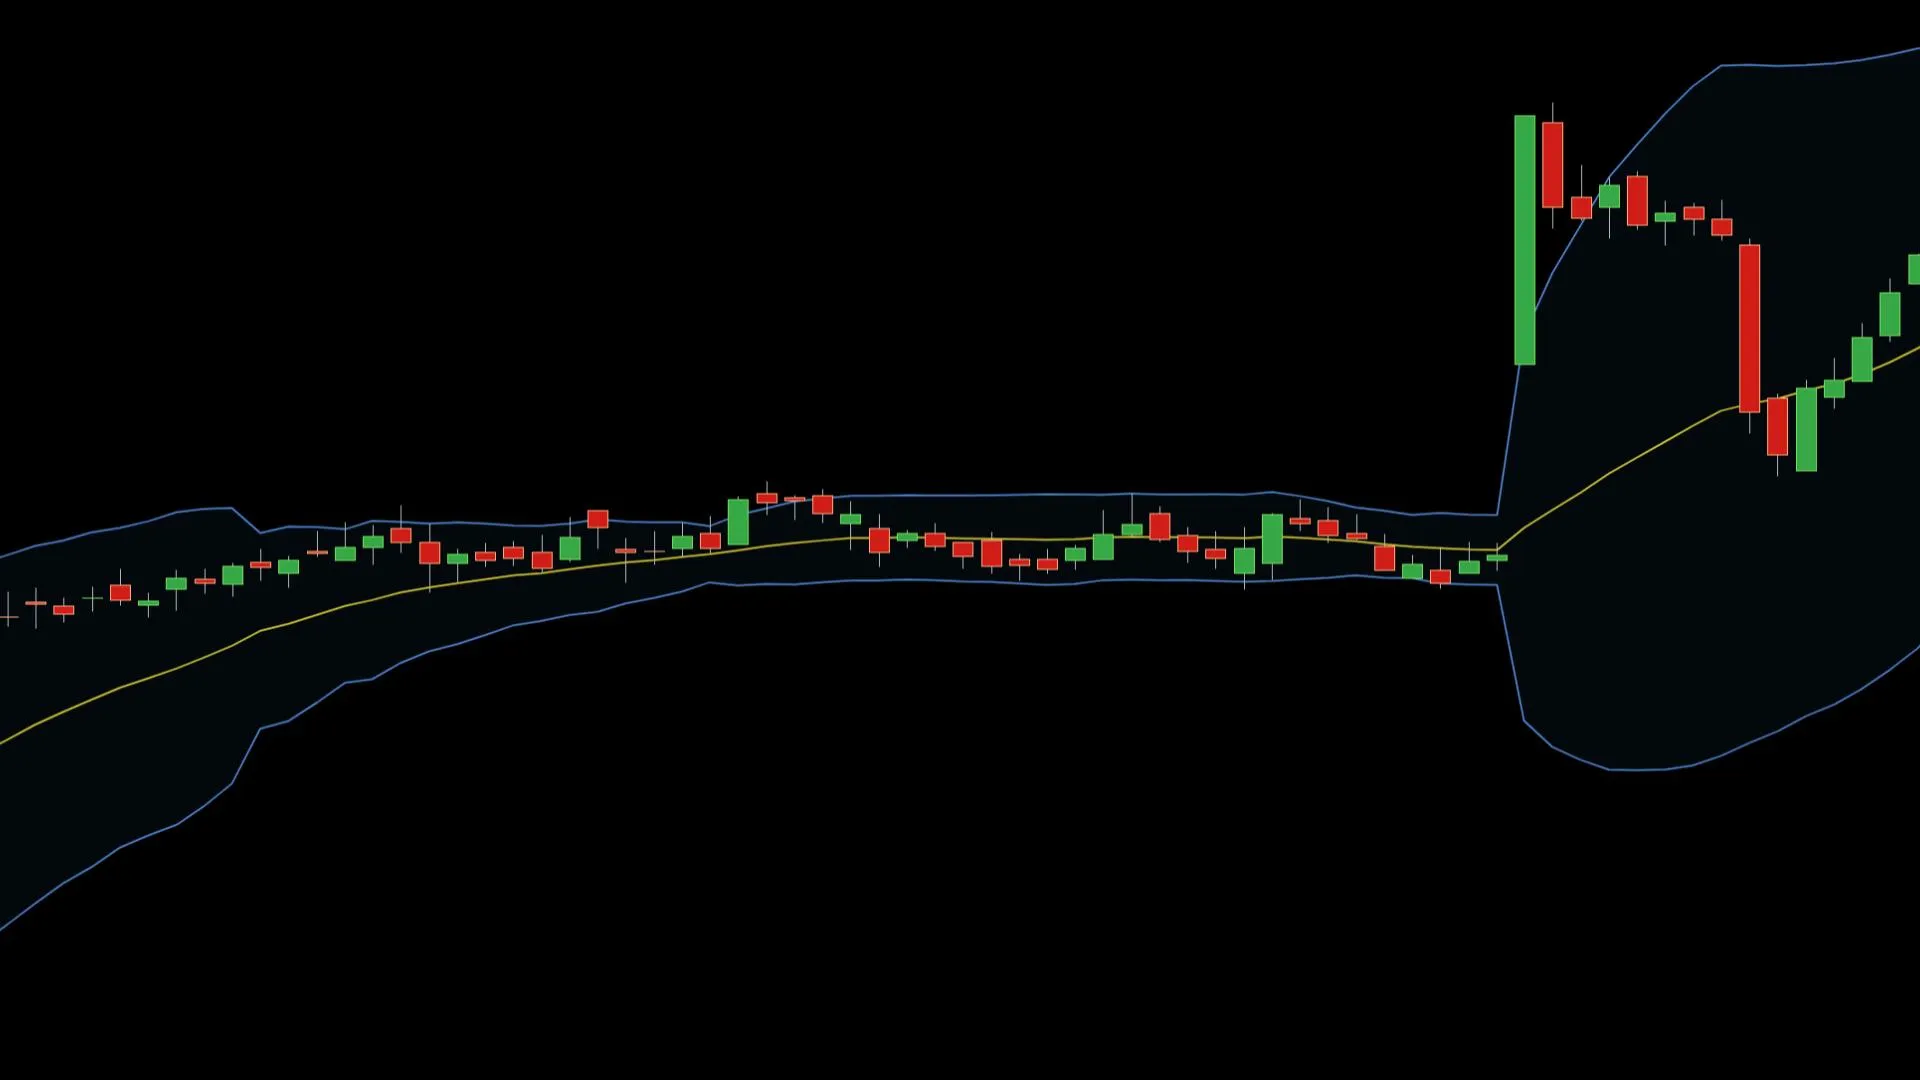
The Power of Walking the Bands in Strong Trends
A powerful signal emerges when price action starts “walking” along the Bollinger Bands during strong trends.
You’ll notice that in strong uptrends, prices consistently touch or ride the upper band, while in downtrends, they’ll hug the lower band. These band dynamics aren’t signals to trade against the trend – they’re actually confirming the market’s strength.
For effective trend identification, don’t make the common mistake of selling just because prices reach the upper band. Instead, use these walks as confirmation of trend strength.
When you spot this pattern, consider trading in the direction of the trend, using the middle band for potential entry points during pullbacks.
Key Principles for Effective Band Trading Strategy
To master Bollinger Band trading, you’ll need to adopt several fundamental principles that go beyond simple buy and sell signals.
Your trading psychology must shift from seeking immediate reversals to understanding market momentum. When bands squeeze together, prepare for potential breakouts rather than forcing trades.
Don’t automatically sell when price hits the upper band or buy at the lower band.
Instead, watch how price behaves around these levels. If you see price walking along a band, it’s often signaling trend strength, not exhaustion.
Mastering Risk Management With Bollinger Bands
Successful risk management with Bollinger Bands depends on your ability to set appropriate stop-loss levels and position sizes.
You’ll want to consider both volatility and trend strength when determining your risk allocation. During squeeze periods, keep your position sizes smaller due to uncertainty.
When you’re trading breakouts, place your stop loss just beyond the opposite band.
If you’re following a walking the bands pattern, use the middle band (20 SMA) as your trailing stop.
Remember that proper stop loss strategies protect your capital from sudden market reversals and help you stay in winning trades longer.
Your Questions Answered
How Do Bollinger Bands Perform in Different Market Timeframes and Conditions?
You’ll find Bollinger Bands work across all timeframes, adapting to intraday volatility and trend analysis. They’re most effective when markets show clear directional movement or significant price consolidation.
Can Bollinger Bands Be Effectively Combined With Other Technical Indicators?
You’ll find Bollinger Band strategies work well with momentum indicators like RSI, MACD, and volume analysis. This technical indicator collaboration helps confirm trends and potential reversals in your trading decisions.
What Role Does Volume Play in Confirming Bollinger Band Signals?
You’ll need volume analysis to validate Bollinger Band signals. Rising volume confirms breakouts after squeezes, while declining volume during band touches suggests weaker moves lacking true signal confirmation.
How Should Band Settings Be Adjusted for Different Trading Instruments?
You’ll need to adjust your bands based on instrument volatility. Consider wider settings (2.5-3 standard deviations) for volatile assets and tighter bands (1.5-2) for less volatile instruments.
When Should Traders Modify Standard Deviation Levels for the Bands?
You’ll want to adjust standard deviations based on your trading strategy customization, market volatility levels, and timeframe. Higher settings work for longer periods, while lower ones suit shorter-term trading.
Conclusion
Bollinger Bands aren’t simple buy-low, sell-high tools. Instead, they’re powerful indicators that work best when you understand market momentum and volatility. Don’t fall for common myths – focus on reading band squeezes, trend strength, and proper risk management. By applying these understandings and staying patient with your trades, you’ll make better decisions and improve your trading success rate.