During the past few months, there has been an endless stream of articles, reports, dissertations and blog posts discussing the many benefits of bitcoin and the cryptocurrency market in general. The majority of these articles focused on bitcoin’s future role in:
- payment processing
- banking
- smart contracts
- distributed storage and other fundamental factors.
It certainly appears that bitcoin is on a path to long-term prosperity in terms of its fundamental value.
Examining Bitcoin Through the Lens of Technical Analysis
What about technical analysis? What information can we gather about bitcoin based on technical indicators like chart patterns, support & resistance levels, moving averages, oscillators and other similar tools? After all, when it comes to properly analyzing an asset, the best way to determine its fair value is to examine the asset from both a fundamental perspective and a technical perspective.
In this post, we will attempt to create a short-term and long-term price forecast for bitcoin based purely on technical analysis.
SHORT-TERM ANALYSIS
Many financial experts claim bitcoin is in the midst of the greatest financial bubble of all-time. In fact, historians claim the recent advance in bitcoin has even exceeded the Dutch tulip bulb mania during the 1630s.
Is bitcoin in a bubble poised to pop?
Based on the simple fact that so many financial analysts and historians are claiming bitcoin is in a giant bubble, it’s probably safe to assume that the digit currency is not in a bubble. At least not a short-term basis.
Although bitcoin is probably not in the midst of a huge bubble, it’s fairly accurate to claim that bitcoin has entered a parabolic advance.
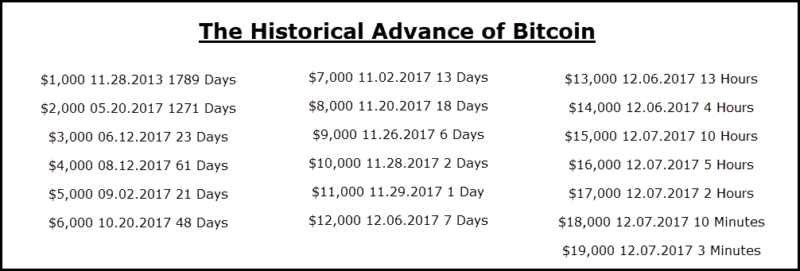
As you can see from the table, bitcoin entered a parabolic advance in the Spring of 2017. At one point, the price was doubling in value every 30 to 60 days.
Of course, this type of advance is unsustainable.
Eventually, the momentum will reach a climax, which probably occurred on December 7th. For now, bitcoin’s parabolic move has been placed on hold. Actually, this is good news if you are an owner of bitcoin because it allows the market to “catch its breath” as it consolidates the huge price move.
Very often, parabolic advances are quickly followed by a complete price collapse. So far, this has not been the case with bitcoin. Instead, the market has been locked in a trading range for the past few weeks. Bitcoin did suffer a substantial decline on December 22nd.
However, at least for now, the market has found a solid level of support near 11000.
Bitcoin CHART #1
Many technical analysts believe bitcoin generated a massive blow off top on December 18 at a price of $19862.
Most likely, this forecast will be proven incorrect.
Certainly, the substantial decline from December 18th through December 22nd should be a cause for concern for the bitcoin bulls. After all, it’s rather difficult to ignore a 45% decline over the course of five days.
However, the market had become incredibly overbought leading up to December 18th.
All short-term stochastic indicators were generating extremely overbought readings. Therefore, bitcoin was due for a healthy correction. As always, just because a market is oversold or overbought, does not mean that market MUST correct but you could be looking for signs of weakness in the case of an overbought reading.
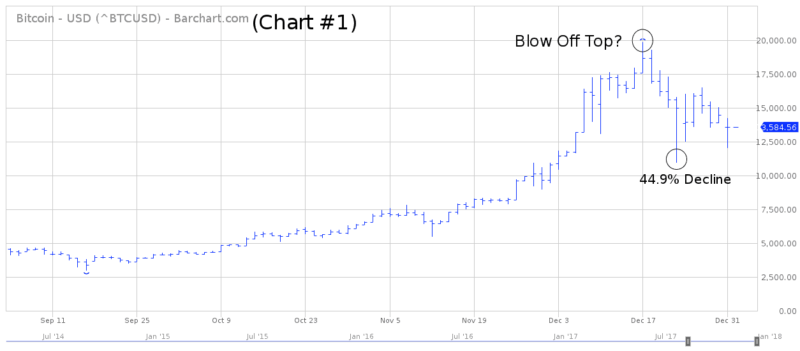
Bitcoin CHART #2
Bitcoin recorded a low of 10934 on December 22nd, which marked the end of its brutal 5-day decline. A strong argument could be made that 10934 is an important short-term technical support level.
In many cases, this analysis is correct because very often a market will revisit its low following a substantial sell-off. Therefore, bitcoin could easily drift back down to the 10934 level.
However, a more important support level is the November 27th low @ 8222. Why? Because this date marks the beginning of bitcoin’s final parabolic move from approximately 8K to 20K in less than three weeks.
If bitcoin wants to maintain its short-term bullish momentum, it needs to stay above 8222 on a daily closing basis. Please review the support level on chart #2.
Bitcoin LONG-TERM ANALYSIS
It’s slightly difficult to provide an accurate long-term technical forecast for bitcoin because the market has only been in existence since 2009. However, we can review the price history for the past eight years.
At least for now, it’s safe to assume bitcoin is in the early stages of a long-term bull market. However, the tricky part is trying to determine if this is a cyclical bull market or a secular bull market.
- A cyclical bull market typically lasts 3 to 6 years.
- A secular bull market is much longer, usually in the neighborhood of 20 to 30 years.
It’s quite possible for bitcoin to be in a cyclical bull market and a secular bear market at the same time. Of course, the strongest price advances occur when both cycles are moving in the same direction (cyclical bull and secular bull).
It’s not possible to accurately determine if bitcoin is in a secular bull or bear market.
We need at least 20 years of historical data, preferably 30 to 40 years.
Bitcoin From A Cyclical Perspective
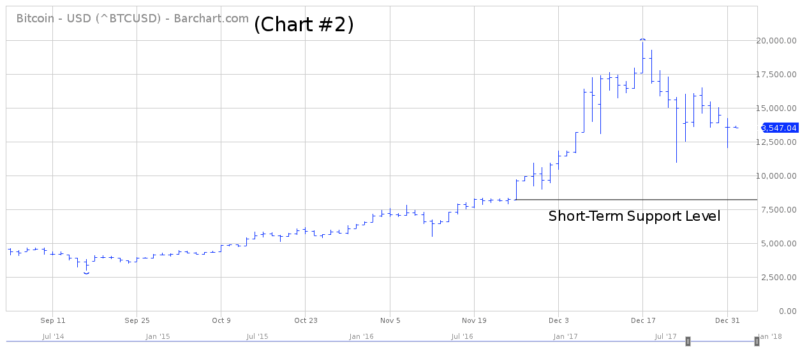
Bitcoin was officially created on January 3, 2009. For the first few years of its existence, the market traded sideways, with a few violent price moves thrown into the mix. The real fireworks began in 2012 and 2013. The price increased several thousand percent over the course of two years, culminating with an important top on November 29, 2013, @ 1135.
Most likely, this date marked the end of bitcoin’s first cyclical bull market. Therefore, bitcoin’s first official cyclical bull market lasted 4 years & 10 months (01.03.2009 thru 11.29.2013). This time fame of 4 years & 10 months fits quite nicely with the length of most cyclical bull markets.
Bitcoin CHART #3
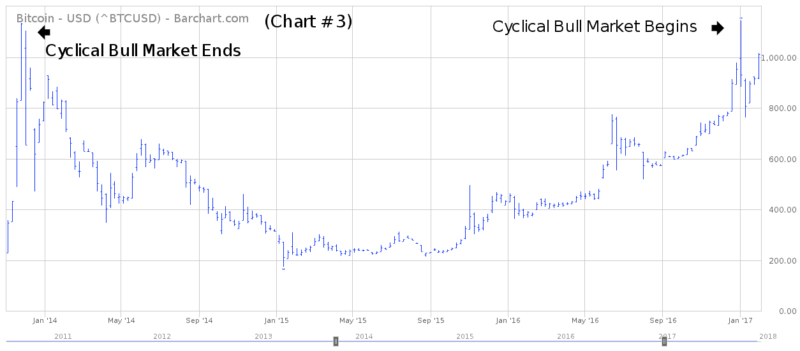
A cyclical bear market ensued immediately following bitcoin’s price peak in November 2013.
The market drifted lower for the next 14 months, forming an important bottom @ 172 on January 14, 2015. Many technical analysts would argue that bitcoin’s new cyclical bear market ended on January 14, 2015.
However, this time frame does not fit the proper definition of a cyclical bear market, which states that a cyclical trend should last 3 to 6 years. Bitcoin’s decline only lasted 14 months, which is not long enough to qualify for a cyclical bear market.
A more proper way to label bitcoin’s cyclical bear market is to use January 5, 2017 as the official ending date. Why? Because this is the date when bitcoin exceeded its previous all-time of 1135 from November 29, 2013. Therefore, bitcoin’s first official cyclical bear market lasted
3 years & 2 months (11.29.2013 thru 01.05.2017). Please review chart #3.
Where Do We Go With Bitcoin From Here?
Without question, bitcoin entered a new cyclical bull market on January 5, 2017. Based on the fact that cyclical trends last 3 to 6 years, the market is still in the early phases of its new bull movement. Most likely, the current bull market will continue until 2021 or 2022. Of course, there will be several nasty short-term declines along the way.
However, the final top should occur in the early 2020s.
How high will bitcoin climb during this current cyclical bull market? That’s the million dollar question. Unfortunately, it’s impossible to provide an accurate answer.
Most likely, bitcoin will be unable to sustain its torrid advance of the past 12 months. However, the market could easily double in value over the course of the next few years. A good number would be 40K to 50K by the early 2020s.
Once again, this is purely a speculative guess. Nobody can accurately forecast the future price direction of bitcoin although it’s probably safe to assume the volatility will continue.
BITCOIN CYCLICAL TRENDS
- 01.03.2009 thru 11.29.2013 (Cyclical Bull Market)
- 11.29.2013 thru 01.05.2017 (Cyclical Bear Market)
- 01.05.2017 thru ? (Cyclical Bull Market)