- October 19, 2023
- Posted by: CoachShane
- Categories: Trading Article, Trading Indicators

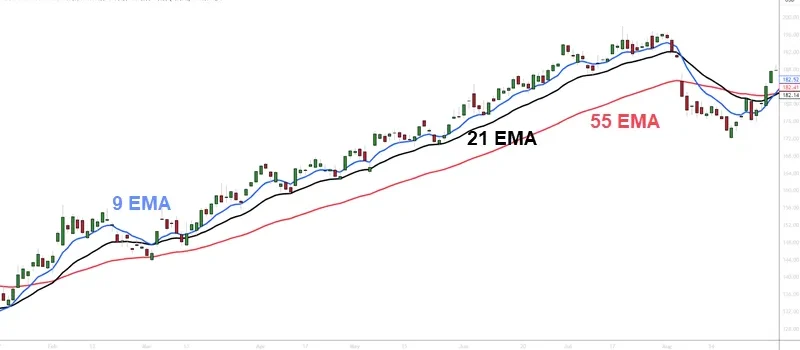
The three-moving average crossover strategy is a trading strategy that uses 3 exponential moving averages of various lengths – 9 EMA, 21 EMA, and 55 EMA. All moving averages are lagging technical indicators however when used correctly, can help frame the market for a trader.
 Using moving averages, instead of buying and selling at any location on the chart, can have traders zoning in on a particular chart location. From there, traders can use various simple price action patterns to decide on a trading opportunity.
You can see how MA’s can give you information about market states by looking at the Alligator trading strategy that I posted a while ago.
Why A 3 EMA Crossover Strategy?
There is no magic in moving averages but they can be used to form the basis of a simple trading strategy that works. You can develop many strategies using moving averages but remember that complex trading strategies are not always best.
Both day traders and swing traders can benefit from a moving average.
The benefits of using a triple exponential moving averages trading strategy?
- Shows us the longer-term trend direction and if the shorter-term trend is in our favor
- We can see a shorter-term trend to determine if we will be taking a with-trend or counter-trend trade
You must keep in mind that the lagging nature of moving averages, even EMA’s, will not enable picking tops and bottoms. That is not a bad thing as times when the trend is changing can make for some sloppy trading conditions.
The main difference between using 2 moving averages, such as the Golden Cross strategy, and 3 averages is having a longer-term trend direction.
The Triple Moving Averages – What Do They Represent?
 As I mentioned, the 3 exponential moving averages will have a different lookback period and they will be:
- 9-period exponential moving average
- 21-period exponential moving average
- 55 period exponential moving average (some will use the 50 EMA moving average but it doesn’t really matter)
55 Period EMA
The 55-period long-term moving average will be considered the longer-term trend direction indicator:
- When the 55 EMA is below both the 9 and 21, we will consider the trend to be up
- When the indicator is above both of the shorter-term moving averages, we will consider the longer-term trend to be down
21 Period EMA
The 21-period exponential moving average is considered a medium-term trend indicator:
- We want to see the 21 below the 9 and above the 55 for an uptrend
- The 21 should be above the 9 and below the 55 for a downtrend
9 Period EMA
The 9-period short-term moving average will be seen crossing over and under the 21 period more times than crossing the 55:
- The 9 EMA crossing over the 21 while already above the 55, is an uptrend and looking for a buy trade
- If it crosses below the 21 EMA while already below the 55 EMA, that is a downtrend and looking for a sell trade
There will be many times when the 9 EMA will crossover the 21-period exponential moving average which will turn the short-term trend against the longer-term trend. There can be trading opportunities in line with the shorter-term trend and against the longer-term trend direction. Your trading strategy has to outline exactly what trades you will take.
When we get a mix of trend directions, we are conservative with profit targets and must exit when facing adverse price action.
You can use simple moving averages with this approach however they will not be as responsive to price changes. The SMA is a slower-moving average in regard to changes in price. Given we are using multiple moving averages that must line up, EMA’s are the better choice.
Trading Strategy With Three Moving Averages
While we could simply trade an EMA cross, that is not the best way of using the 3 EMA’s. Expect a lot of whipsaw if you decide to take a trade based on only a crossover of any moving averages. Setting up and testing a moving average trading strategy that you will use is key to finding trading success.
You can tell a lot about the market from the state of the moving averages:
- When the indicators are jumbled together, consider the market to be in a trading range
- When the faster-moving average starts to pull away from the others, consider momentum entering the market
- Seeing the 9 21 ema crossover and separating, we are looking at a trending market
- When all the averages line up, a strong trend is in play
From those four items, we can determine what type of trading setups we need to enter the market. We will also consider using support and resistance to help us determine a trade setup.
Trading Rules – Buy Trade
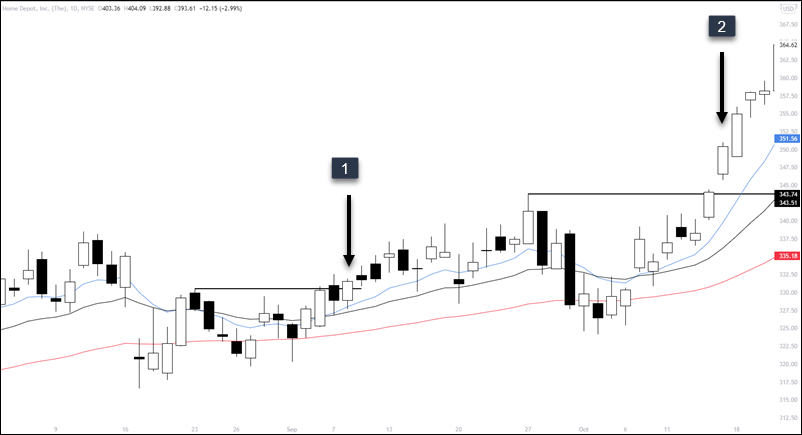
This is a daily stock chart with two different setups with an obvious market trend to the upside – a bullish trend.

- The 9 EMA has crossed to the upside and the noted arrow closes above the last swing high. This is a short-term resistance level that is broken
- Price has pulled back and the 9 EMA crosses to the upside. Traders would have to wait until there is a close above the last swing high
Using price, market structure, and the EMA’s, you found yourself in two pretty good trades depending on your approach to using the trading signals provided.
Continuation Trade – One Example
Once we are in a confirmed trend, we can look for the 9-period exponential moving average to cross over the 21 EMA which reverses the short-term trend direction.
Our first chart example didn’t really have a trend occurring until after the second trade as shown by the exponential moving averages.
We can use the same rules for a continuation trade: look for a swing high to be taken out once the 9/21 cross back in an uptrend direction.

This a daily stock chart of NIO. After a very large run-up in price, we get a continuation setup.
A legitimate setup with a close above the last swing high as there was a crossover of the 9 moving average to the upside.
Depending on where you place your stop, you’d have participated in the next move of a 35% run in price.
The key to continuation trades is that we need to be in a trend prior to the continuation trade.
Trading Rules – Short Setup
- We use the lowest swing low of the range as the area that needs to break to consider shorts
- The 21 EMA has crossed the 9 and crossed the 55 EMA setting up a short
- Sell the close of the candlestick that forced the moving average crossover
The short setup is the mirror opposite of the buy setup and they share the same vital variable: we need to see a pivot low or high broken before taking the trade.
This is an hourly chart of crude oil futures. You can see the crossover of the averages, the black arrow breaks the support level and traders enter short.
This is a very simple trading setup.
The issue is how you work your protective stops, manage your trade, and take profits.
Continuation Trade – Second Example
There will be times when the trend is so strong that we don’t get the 9 EMA crossover.
In that case, we can look for a pullback into the 9 EMA and 21 EMA.

Allow price to pullback into the zone and this chart has two trade entries:
- Failure test entry where price probes below support and are rejected
- Standard breakout and strong close trade entry
When the moving averages do not crossover, we are in a strongly trending market. You should have a trading plan that looks to take advantage of these price moves
Stop Loss + Profit Taking + Trailing Stops
There are many ways to place your stop loss on these types of trades and there are a few things to keep in mind:
- Allow room for the price to move so avoid a tight stop loss
- Be consistent
Using the 2 X ATR allows your stop to remain outside the normal volatility and allows the price to fluctuate.
Swing Highs/Lows
Using previous swing highs or lows are a simple visual area but due to the lagging nature of moving averages, the pivots may be far from the price

This is using a 2 times the ATR from close for the stop loss.
The target is a 1R and you can adjust your stop, take partial profits, or whatever fits your trading plan.
You could use the swing low or just below the entry candlestick. Whatever you use for your moving average trading approach, ensure you are consistent with each trade you take.
Takeaways
The lagging issue with a moving average crossover strategy can cause problems such as price moving too far too fast. This can have us getting into a trade just when the price snaps back to an average price.
The good thing is we can judge momentum based on the separation of the averages as well as the distance the price is from the averages.
Adding in the needed breaks of swing levels in all trades except the continuation of two methods ensures that the price is showing us a trending price pattern.
Having three moving averages helps us have no doubt if a market is trending or is ranging.
- If we see a separation in the averages, we have a trend
- If the price is whipping back and forth around the averages, we have a range
The first trade out of a reversal and the first pullback/continuation trade, have proven to be the most reliable.
If you don’t blindly trade the 3 EMA crosses, and take into account support and resistance, you could find an edge in this type of strategy where you take advantage of trend, momentum, and simple trade management and profit-taking routine.
Tired Of Trading With Overused Indicators?
Try something different and get the
“Ultimate Guide to Price Pattern Trading” – ABSOLUTELY FREE!
Learn how to trade with precision and accuracy, find ideal entry points with low risk,
and create a lifetime of trading income using patterns and price action.
Download your FREE guide now and start mastering the art of successful trading!
9 Comments
Comments are closed.


When value of the 21 EMA is in the MIDDLE of EMA 9 AND EMA 55 AND EMA 9 IS CROSSING DOWN 21 FROM ABOVE 21 TO BELOW EMA 21. What should be the nature of the trade ? I appreciate your generosity to educate the traders by your so many mails and videos. I have found them ti be educative. They are excellent mentoring .
The shorter term trend is down while the longer term trade is still up. In this case, you are probably looking at a deeper pullback in the current trend. Managing the trade tighter than usual would be my next step if long. If not in a trade, I’d have to see some time of price action/structure indicating that the buyers are still in control or regaining control. Good question
which time frame we can use this 3ema means 5mn / 15mn/ 30mn/ 1hour / 4 hour / day
Any time frame you choose
You are a great sir thank you 😊❤️
How long do you hold long, medium and short term plays typically?
There is no typical time as the market dictates when it’s time to hit the exits. Since I trade off daily charts, I am always looking at more than 3 days and have held positions for the better part of the year. That is especially true in currencies. There are the very obscure outliers that end the same day due to interventions or words from govt officials.
Good Eve Sir, Mr.Shane you did an interesting take on the use of the EMAs. I as well use EMAs. However, there is no explanation to why these particular three; the 9, 21 and 50 EMAs. Why not 3, 20, 200 EMAs or any other combo. I gather you use them because there is some unique qualities for the ones you use. So what’s up ? Thank you Kindly
Hey John – Simply looking at a short, medium, and longer term averages. Honestly, if your strategy works with a 10 EMA but doesn’t with a 9 or 11 ( 8,12), then the strategy is way overoptimized. The longer term one – there is a difference between 50 and 200 but 60 or 40 makes little difference.