- August 7, 2025
- Posted by: Shane Daly
- Categories: Trading Article, Trading Tutorials
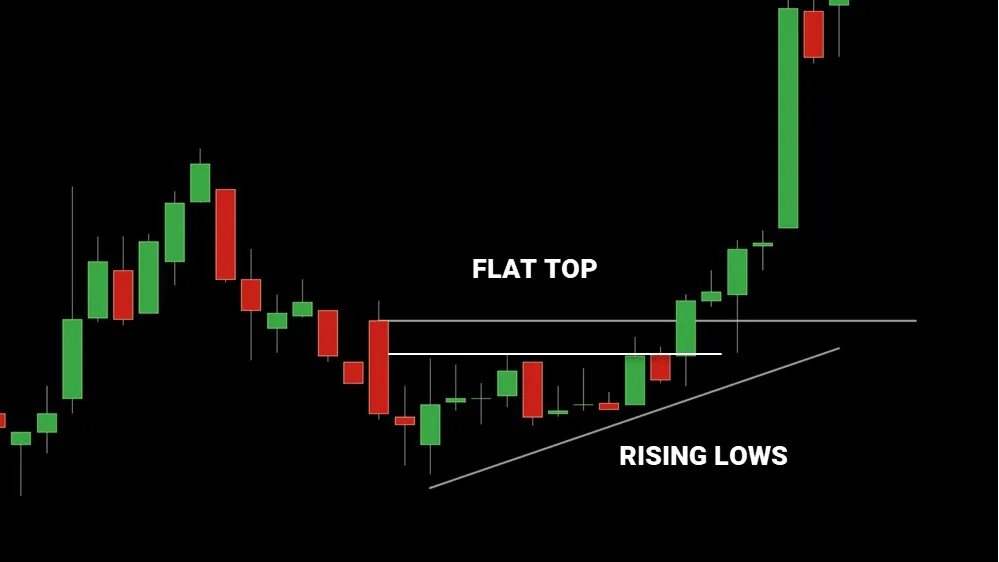
Ascending triangles represent one of the most reliable chart patterns in technical analysis, offering traders a structured approach to identifying potential breakout opportunities. These patterns show up when price action creates a flat upper resistance line while establishing progressively higher lows, signaling growing buying pressure. While many traders recognize this pattern, mastering its nuances and understanding the associated risks can make the difference between profits and losses.
Video Highlights
- Ascending triangles have a high success rate of 72-83%, making them reliable chart patterns when properly identified and traded.
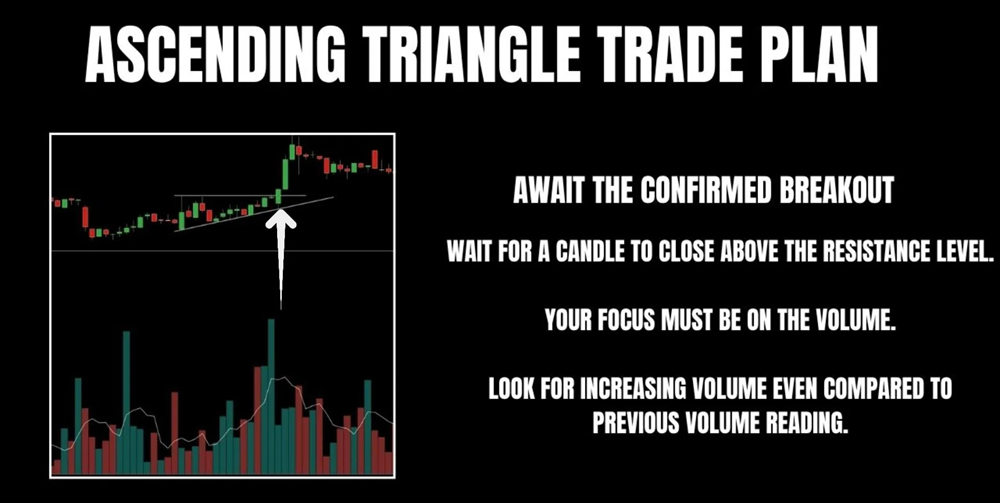
- Volume confirmation is essential for valid breakouts, requiring 50-100% above average volume to signal genuine market participation.
- Entry strategies can be aggressive (enter at breakthrough) or conservative (wait for retest), depending on risk tolerance.
- Place stop losses below the most recent swing low and calculate profit targets using the triangle’s height.
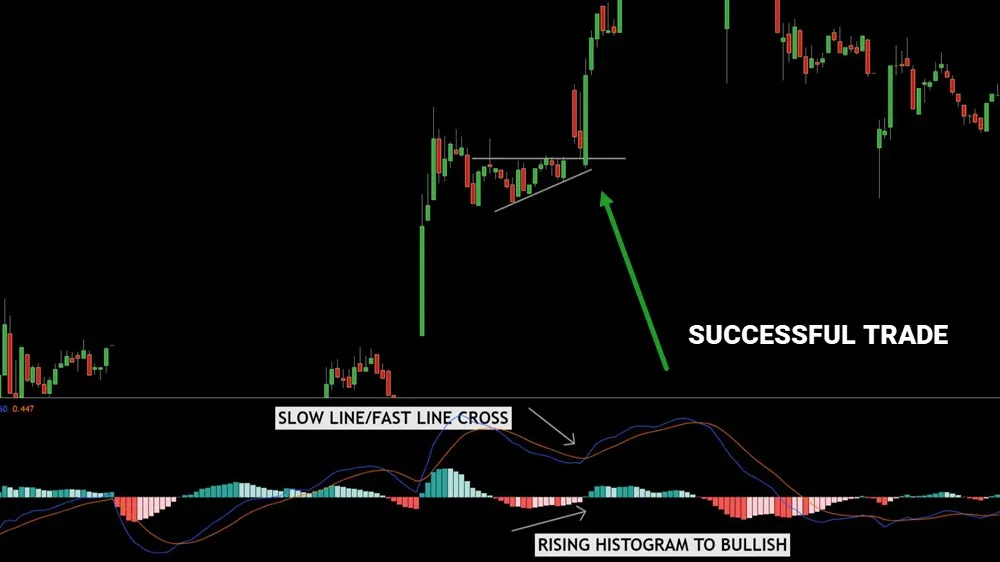
- Combine technical indicators like RSI and MACD with pattern analysis to increase trade setup reliability.
Ascending triangles is one of the most reliable chart patterns in technical analysis, offering traders a powerful tool for identifying potential breakout opportunities. With success rates ranging from 72% to 83%, these patterns require a solid trading psychology and a well-defined breakout strategy to capitalize on their potential. The pattern forms when price creates a flat horizontal resistance level while making higher lows, showing increasing buying pressure against steady selling resistance.
Trading these patterns requires attention to volume, which is an important confirmation tool. A genuine breakout should be accompanied by volume that’s 50% to 100% above average, signaling strong market participation. Without this volume confirmation, traders risk falling victim to false breakouts, where price briefly pierces resistance before reversing sharply.
Successful traders approach ascending triangles with a systematic method. They first validate the pattern by identifying at least two tests of resistance and two higher lows. Once confirmed, they watch for a decisive close above resistance with strong volume. Entry strategies can be either aggressive, entering at the close of a breakthrough candle, or conservative, waiting for a retest of the former resistance level.
Risk management plays a vital role in trading ascending triangles. Traders should place their stop losses below the most recent swing low to protect against market noise. For profit targets, they typically measure the triangle’s height at its widest point and project this distance upward from the breakout point. This provides a data-driven objective for the trade.
Volume isn’t the only confirmation tool traders should consider. Additional indicators like RSI and MACD can provide extra validation. An RSI above 50 and rising, combined with a bullish MACD crossover during the breakout, can strengthen the trade setup.
Your Questions Answered
How Long Does It Typically Take for an Ascending Triangle to Form?
Ascending triangles typically show varying formation duration, ranging from a few weeks to several months.
The pattern’s development depends on price fluctuation frequency and market conditions. While shorter timeframes may form in 2-4 weeks, most reliable formations take 1-3 months to develop fully.
This allows enough time for the pattern to establish clear resistance levels and higher lows through multiple price tests.
Can Ascending Triangles Appear in Downtrends, and Are They Still Reliable?
Yes, ascending triangles can form during downtrends and often signal potential bullish reversal indicators when they do.
While their reliability is slightly lower in downtrends compared to uptrends, they still maintain significant predictive value.
Traders should pay extra attention to volume confirmation and other supporting signals, as these patterns in downtrends may require stronger validation before taking positions to ensure higher probability trades.
What’s the Minimum Price Range Needed for a Valid Ascending Triangle?
There isn’t a strict minimum price range required for triangle validation, but the pattern should be large enough to be clearly visible and tradeable.
Generally, the price range between the highest and lowest points should be at least 3% of the asset’s price to ensure meaningful price movement.
Smaller ranges might lead to unclear signals and could be more susceptible to market noise and false breakouts.
Do Ascending Triangles Work Better in Specific Market Conditions or Timeframes?
Ascending triangles tend to perform best during bull market conditions when there’s steady upward momentum.
They work particularly well on daily and weekly timeframes, where market noise is reduced and patterns have more reliability.
However, excessive volatility can disrupt pattern formation and increase false breakout risks.
The pattern’s effectiveness also depends on sector-specific trends and overall market sentiment rather than just timeframe selection.
How Often Should the Resistance Line Be Tested Before Considering Entry?
For reliable entry point strategies, traders should look for at least two distinct tests of the resistance line in an ascending triangle.
More tests can increase pattern reliability, with three to four touches being ideal. However, too many tests (five or more) might indicate weakness in the pattern.
The quality of these tests matters more than the quantity – each touch should show clear rejection and respect of the level.