
- May 26, 2026
- Posted by: Shane Daly
- Categories: Basic Trading Strategies, Trading Article

Your stop loss is probably not protecting you. It may be causing the problem.
Most traders place stops where the loss feels acceptable. That feels disciplined, but it usually puts the stop inside normal market noise. Price wicks, pulls back, tests levels, and clips the stop before the trade has a real chance to work.
A useful stop does not mark your pain threshold. It marks the price where your trade idea is wrong. That usually means placing it beyond structure, then checking the distance against volatility.
TLDR
- Place stops beyond key structural levels like swing highs, swing lows, support, and resistance to avoid premature exits from normal price noise.
- Use ATR multipliers to size stop distances appropriately: 1.5–2x for day trades, 2–3x for swing trades, and 3x+ for high volatility.
- Define trade invalidation levels before entering, ensuring stops reflect where your trade thesis genuinely fails.
- Never move stops emotionally to avoid losses; doing so converts manageable losses into significant account damage.
- Let stop distance determine position size by dividing your defined account risk (0.5–2%) by the stop distance in dollars.
Why Most Stop Losses Get Triggered Too Early
Why do most traders set their stops in exactly the wrong place? Because they're guessing. Stop loss psychology is rarely discussed honestly, but the truth is simple: most traders place stops based on comfort, not logic. That's a costly mistake.
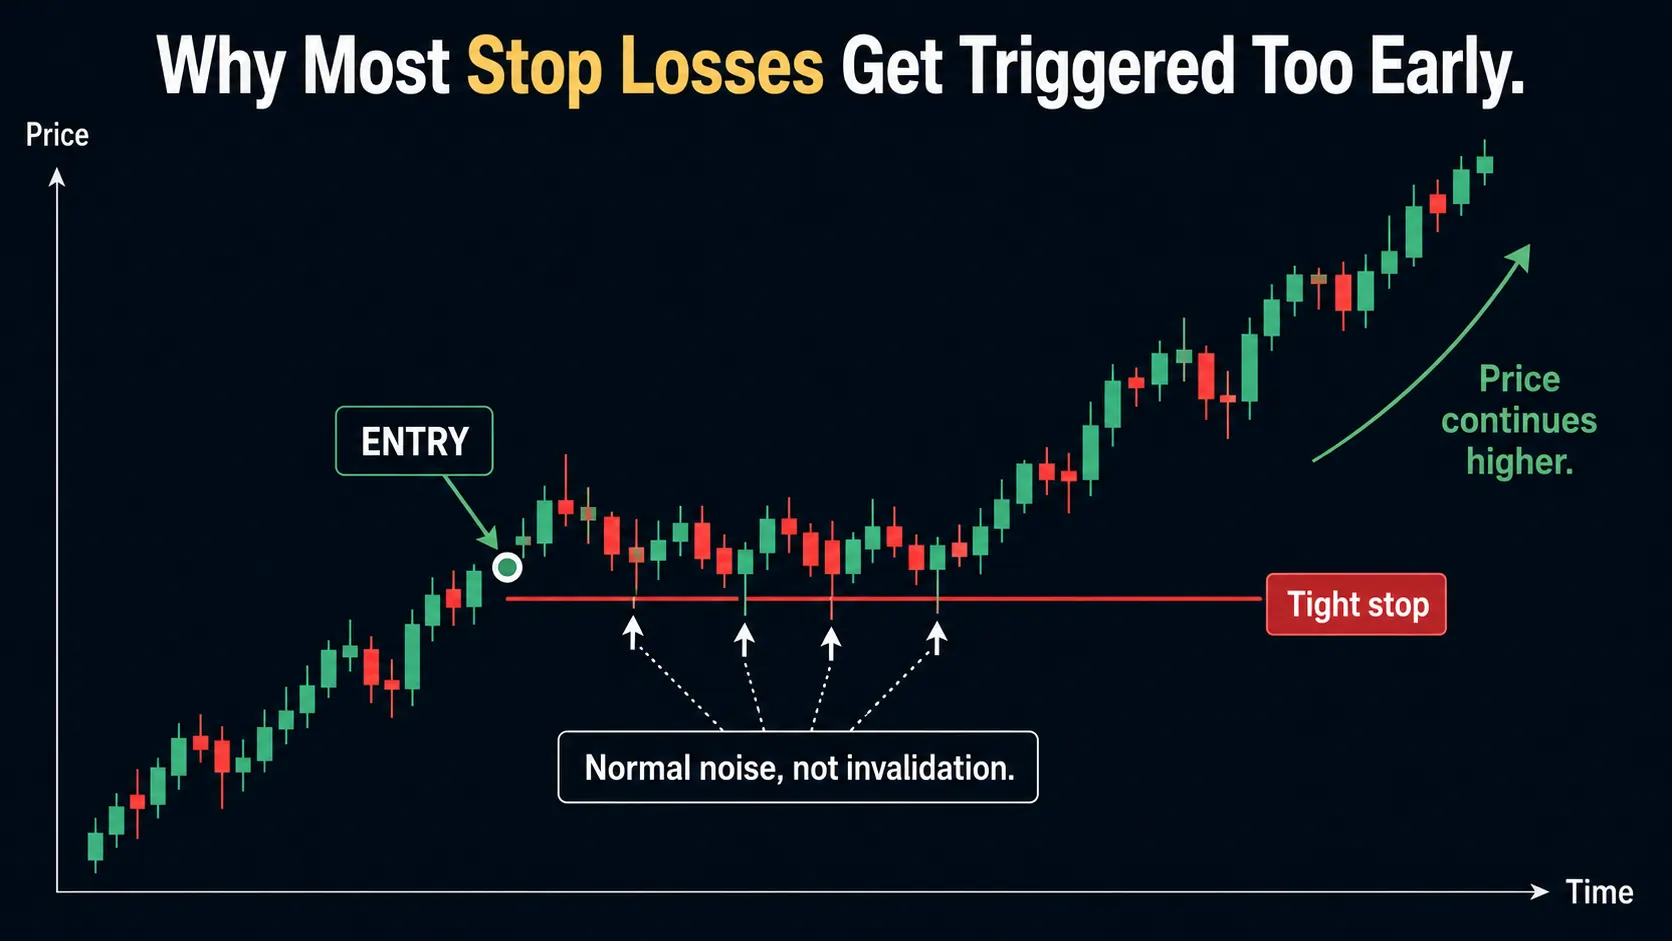
One of the most common misconceptions is that a tight stop means lower risk. It doesn't. A stop that's too close gets clipped by normal price noise before the trade even has a chance to work.
You're not managing risk. You're guaranteeing small losses while eliminating any chance of a winner.
Price moves. It wicks. It tests levels. If your stop can't survive basic volatility, it was never a real stop. It was just fear wearing a strategy costume.
Structure-Based Stops: Use Market Levels, Not Gut Feelings
The market has structure. Price action leaves clear marks—swing highs, swing lows, support zones, resistance levels. These aren't suggestions. They're the map you should be using to place every stop loss.
Most traders ignore the map. They pick a number that feels comfortable, place their stop there, and call it risk awareness. That's not discipline. That's guessing with consequences.
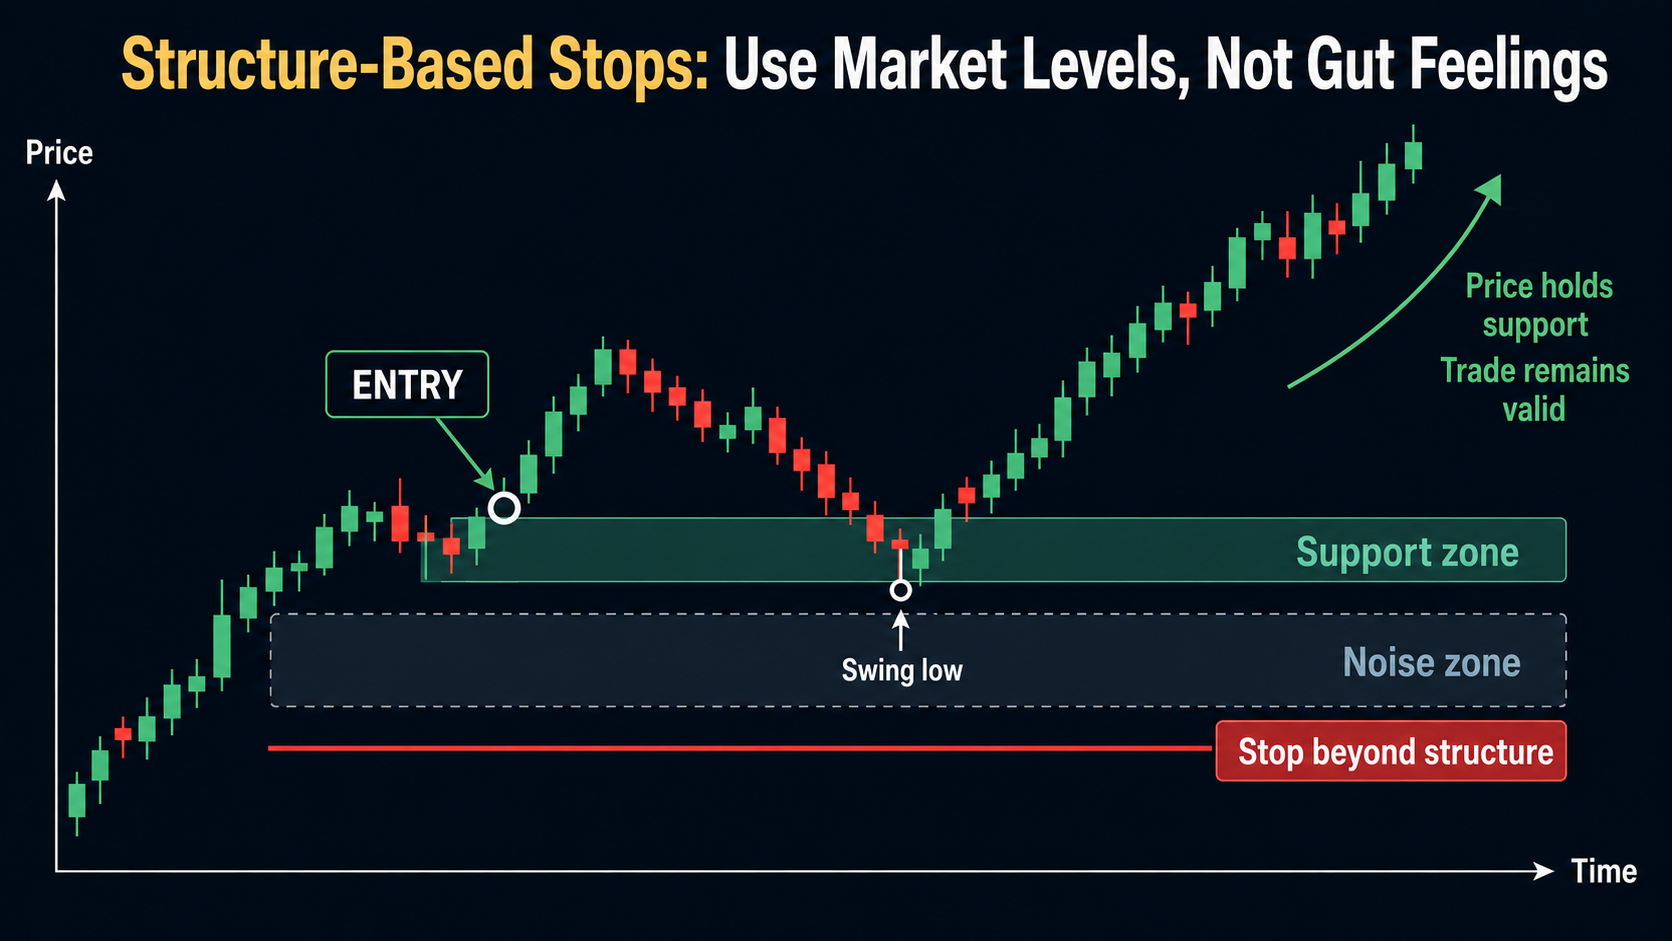
Structure-based stops work because they're tied to invalidation levels. If price breaks below a key support zone, your trade thesis is wrong. That's where your stop belongs—just beyond that level, not inside the noise.
Market structure tells you when you're wrong. Your gut doesn't. Stop letting emotions decide your exits. Use the chart. Trade with logic, not feelings.

How to Place Stops Using ATR and Volatility
Placing a stop based on structure is smart, but structure alone doesn't account for how much a market is actually moving. That's where ATR calculations come in. ATR measures recent price movement, giving you an objective volatility assessment instead of a guess.
The formula is simple: subtract your ATR multiple from entry for longs, add it for shorts.
| Trade Type | ATR Multiplier | Typical Use |
|---|---|---|
| Day Trade | 1.5–2× ATR | Intraday setups |
| Swing Trade | 2–3× ATR | Multi-day holds |
| High Volatility | 3× ATR+ | Volatile instruments |
Combine structure with ATR. If your structural stop requires more than 1.5× ATR, skip the trade. That distance isn't protecting you—it's punishing you. Widen your stop intelligently, or don't trade it.
At What Price Is Your Trade Idea Actually Wrong?
Most traders set stops based on how much they're willing to lose. That's backwards. Your stop should mark the price where your trade idea is simply wrong.
Ask yourself one question before entering: at what price does my thesis break down? Maybe it's below a key swing low. Maybe it's above a resistance level you expected to hold. Define it before you enter.
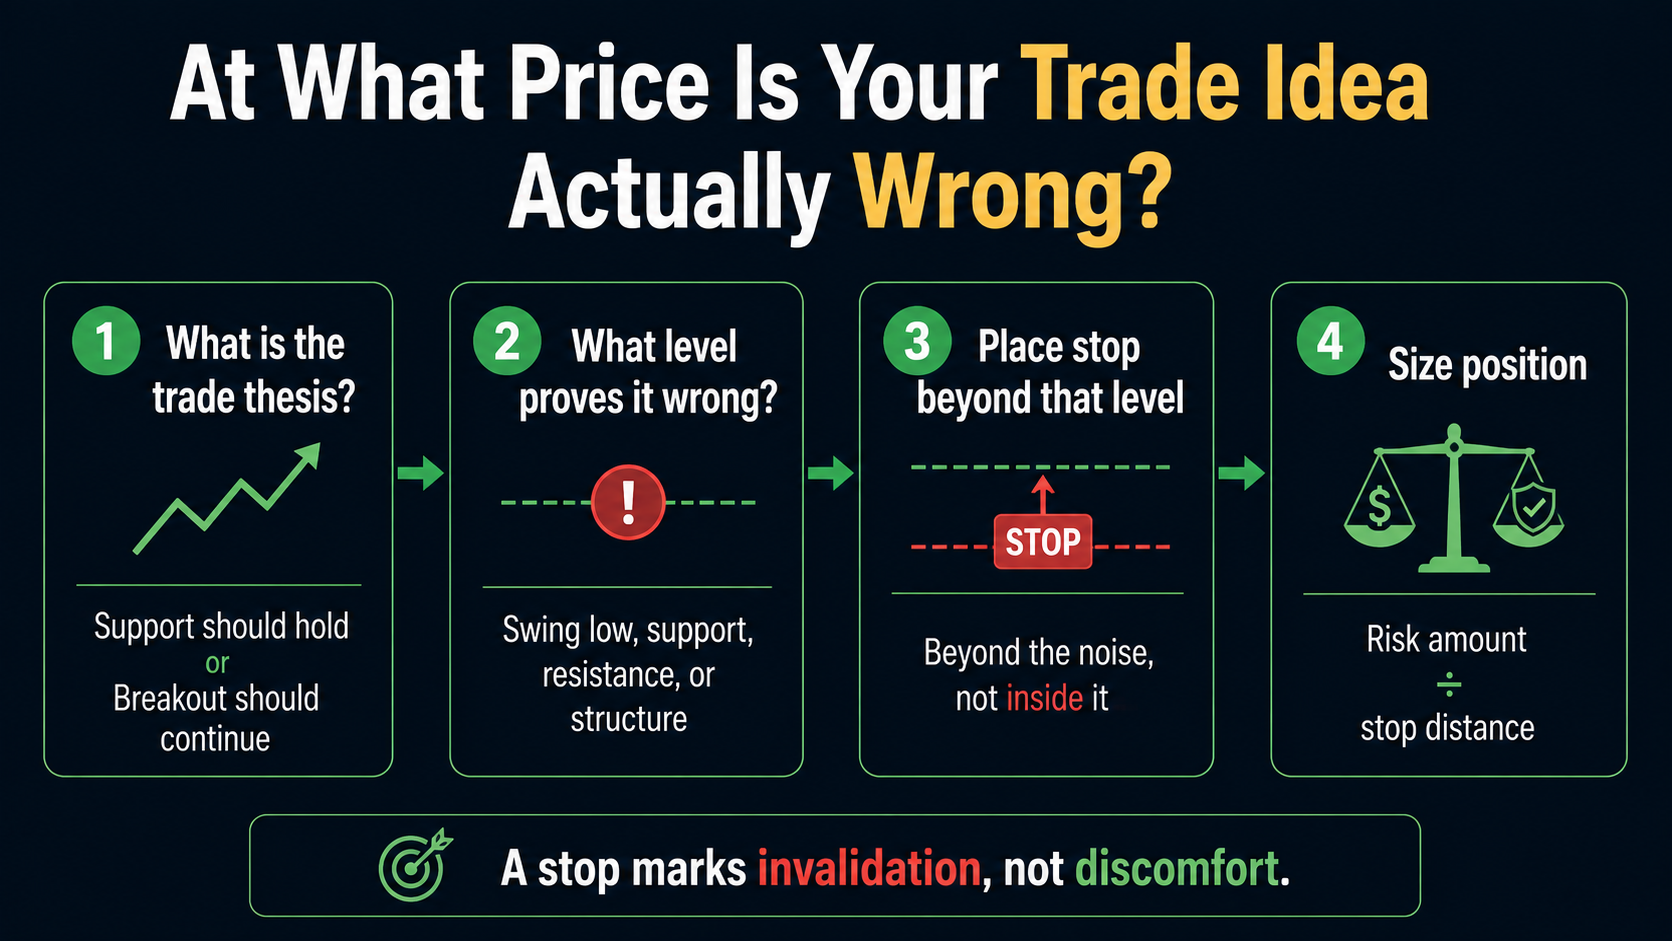
Your invalidation criteria should be structural, not emotional. If price breaks the level that justified your entry, the trade is over.
Don't move your stop to avoid taking the loss. Emotional overrides don't save trades—they turn manageable losses into account-damaging ones.
The stop isn't your pain threshold. It's the market telling you that you were wrong.
Trailing Stops, Time Exits, and Cross-Asset Triggers
Once you're in a trade, your job isn't just to survive—it's to manage the position as conditions change. Trailing stops let you lock in profit as price moves in your favor.
But trailing mechanics matter. Trail too tight, and normal pullbacks stop you out early. Trail too loose, and you give back too much. Use structure-based trailing—move your stop behind higher lows on longs, lower highs on shorts.

Time frames impact how you trail. Shorter time frames require tighter adjustments. Swing trades need room to breathe.
Time exits are equally serious. If price doesn't move within your expected window, get out. Dead capital is wasted risk.
Cross-asset triggers work the same way. If correlated markets contradict your thesis, that's a soft exit signal. Act on it.
Size Your Position Around the Stop, Not the Other Way Around
The stop determines everything else. Most traders size their position first, then squeeze a stop around it. That's backward, and it's one of the most common risk management mistakes you'll make.
A wider stop does not automatically create more risk. It only creates more risk when the trader refuses to reduce position size. In this example, the $2.00 stop distance allows for 100 shares while keeping planned risk at $200.
Define your stop first—based on structure or volatility—then calculate your size using this formula:
- Account risk per trade – Risk 0.5–2% of your equity per position.
- Stop distance in dollars – Measure from entry to your stop level.
- Position size – Divide account risk by stop distance.
Don't let psychological barriers push you into over sizing because your stop feels “too wide.” A wide stop with correct sizing still controls your risk.
A tight stop with oversized shares doesn't. Let the math make the decision.
Conclusion
Your stop loss is a decision, not a decoration. If you're placing it randomly or skipping it entirely, you're not trading — you're gambling with a time delay. Use structure. Use volatility. Know exactly when your trade is wrong before you enter it. Then size accordingly. Do this consistently, and you'll survive long enough to actually get good. That's the whole game.
