

- July 29, 2025
- Posted by: Shane Daly
- Categories: Trading Article, Trading Indicators

If you’re looking to improve your trading strategy, the Double Bollinger Band approach might be exactly what you need. This powerful technical tool combines two sets of bands to create clear trading zones, helping you identify optimal entry and exit points while avoiding choppy markets. Unlike single bands that can give mixed signals, this dual-band system offers a more refined way to spot genuine trends and potential reversals. Let’s explore how you can put this strategy to work.
Video Highlights
- Understand the three trading zones: uptrend between upper bands, downtrend between lower bands, and no-trade zone between inner bands.
- Confirm trade signals using additional indicators like RSI or MACD, and always validate with volume analysis.
- Avoid automatic trading at band touches; instead, wait for price action confirmation and supporting technical signals.
- Adjust band settings based on market volatility, using wider standard deviations for crypto and shorter periods for fast markets.
- Monitor Bollinger Band squeeze patterns as potential breakout indicators, especially when accompanied by increasing volume.
The Double Bollinger Bands strategy takes the classic technical indicator to a whole new level by adding a second set of bands to your charts. You’ll use the standard 20-period moving average with two sets of bands – one at two standard deviations and another at one standard deviation. This creates three distinct zones that’ll help you identify strong trends and avoid choppy markets.
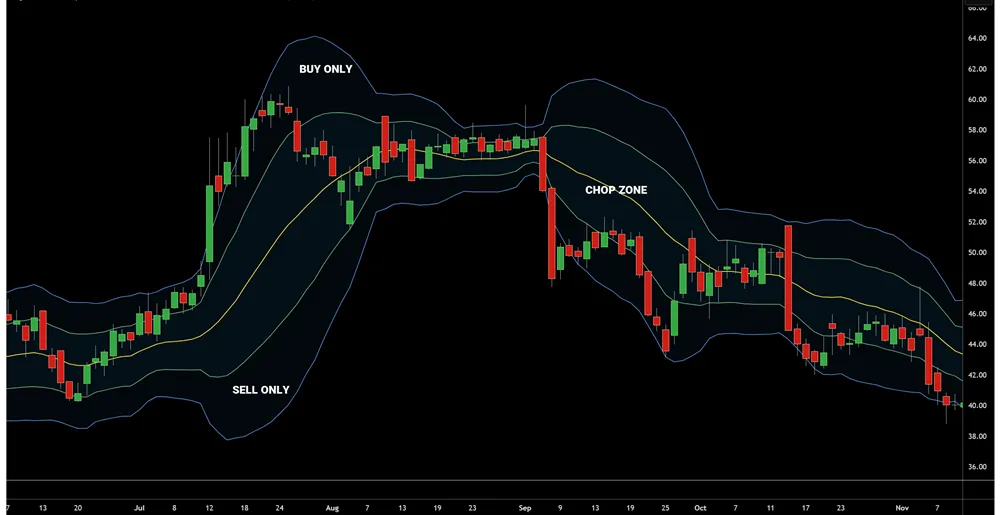
When you see prices moving between the outer and inner upper bands, you’re looking at a potential uptrend zone. Similarly, when prices are between the outer and inner lower bands, you’re witnessing a downtrend zone. The area between the inner bands is your “no-trade” zone, where prices often get stuck in choppy, directionless movement.
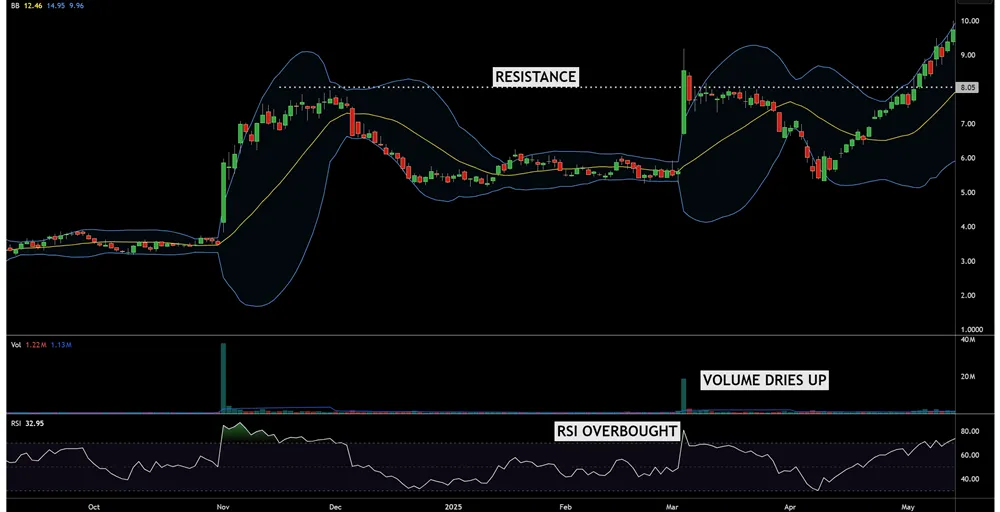
You’ll want to confirm your trades with other indicators before jumping in. Look for RSI or MACD divergence when prices touch the bands, and always check if volume supports your trading decisions. Low volume near the bands might signal a fake move, while high volume often confirms a genuine trend or reversal.
Don’t fall into the trap of automatically buying at the lower band or selling at the upper band. Sometimes prices can “walk the band,” meaning they’ll continue moving along the outer bands during strong trends.
You’ll need to adjust your band settings based on your market and timeframe. For fast markets, try a 10 or 14-period setting, and for crypto trading, you might want to widen your standard deviations to 2.5 or 3.
Remember to watch for the Bollinger Band squeeze, where the bands contract significantly. This often signals a coming breakout, but you’ll need volume confirmation to trade it effectively.
Your Questions Answered
How Do You Handle False Signals When Price Briefly Enters Trending Zones?
When price briefly enters trending zones, you’ll want to wait for confirmation before taking action.
Look for strong volume and additional technical signals like RSI or MACD to back up the move.
Don’t rush into trades – give the price a chance to prove itself.
Consider using a time filter, waiting 2-3 candles to ensure the move isn’t just market noise.
Keep your stops tight during these moments.
What’s the Optimal Timeframe Combination for Using Double Bollinger Bands?
You’ll want to combine multiple timeframes for a comprehensive view.
Start with a higher timeframe (4-hour or daily) to identify the main trend, then drop to a lower timeframe (15 or 30-minute) for entry signals. This combination helps you avoid false signals and spot stronger setups.
For day trading, use 1-hour charts for trend direction and 5-minute charts for precise entries.
Can Double Bollinger Bands Be Effective in Ranging or Sideways Markets?
Double Bollinger Bands can actually be very helpful in ranging markets by clearly showing you the chop zone between the inner bands.
You’ll want to focus on trading bounces off the outer bands back toward the middle, rather than looking for trending moves.
It’s crucial to wait for price to reach the outer bands and show reversal signals before entering trades, as this increases your probability of success.
Should Stop Losses Be Placed Outside the Outer Bollinger Bands?
Placing your stop losses outside the outer Bollinger Bands can be risky.
You’ll want to set them closer based on your trade’s context and market conditions.
While the outer bands show extreme price levels, they don’t always make ideal stop points.
Instead, use support and resistance levels, recent swing points, or a fixed percentage of your position size to set more strategic stops that protect your capital effectively.
How Do You Determine Position Size Based on Double Bollinger Band Signals?
You’ll want to size your positions based on the distance between the bands and your risk tolerance.
Calculate the pip distance from your entry to where you’d place your stop loss (typically near the outer band). Then, determine what percentage of your account you’re willing to risk per trade (usually 1-2%).
Use this to calculate the exact position size that keeps your risk within those parameters.
Conclusion
You’ve now got the tools to master Double Bollinger Bands trading. Remember to watch those trading zones carefully and wait for clear signals between the bands. Don’t forget to back up your strategy with other indicators like RSI and volume analysis. Keep practicing with different timeframes and market conditions. When you spot that band squeeze, get ready – it often signals your next big trading opportunity.