- September 29, 2014
- Posted by: CoachShane
- Categories: Basic Trading Strategies, Trading Article, trading videos

In this next installment of how to trade your trading profits, we are going to head back to the years 1170-1240 of the days of Leonardo Bonacci.
There’s no need to get into the history of Fibonacci as there is so much on the internet and in published material about the ratios.
The history is not what is really important to us in terms of taking your profit exits when trading.
Why Use Fibonacci
Fibonacci trading can give you exact and objective price points to exit any trade that you are in. The way we are going to use them is also going to give you one key element that must be present for a chance of trading success: Consistency.
You will also be able to have trade plans that give you the chance to scale out partial profits, hold for an all out target, and also have a way to measure if the trade has strength to fulfill your objective.
Two knocks against Fibonacci:
- Draw a bunch of lines one will probably get hit
- Too subjective which highs and lows to use
I agree with both however we will be using 3 (you could only use 2) PLUS our highs/lows are simple to spot. I will detail that later.
Before I start, usual disclaimer that you must test, verify, and prove to yourself that this concept makes sense to you. I am sharing this with you because this is a method I personally have used over the years depending on the trade plan I was using.
This is not something I invented but picked up from a few traders including the late Mark Braun.
Fibonacci Ratios For Profit Exits
We are going to use .786, 1.272, and 1.618 in this method although you can use .50 and .618 for objective areas to scale out of your trade. These are a combination of retracements and extensions.
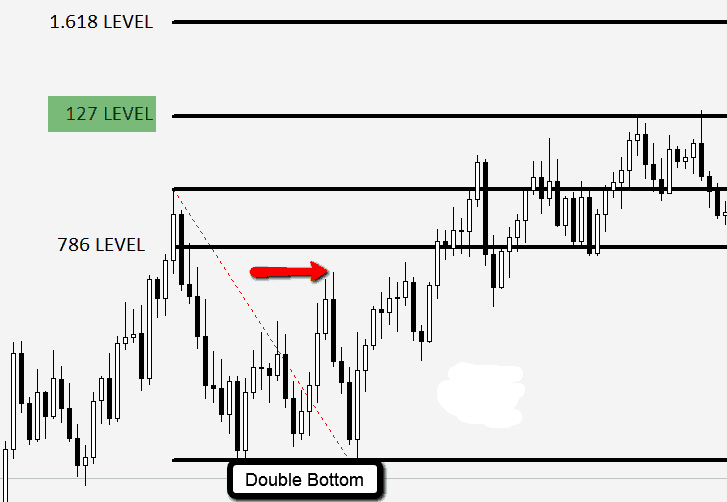
- .786 – This ratio is our confirming ratio. If price fails at this level, we may want to tighten up our stop or exit the trade completely. If this level breaks in the direction of our trade, the next ratio comes into play.
- 1.272 – If the .786 level breaks, we will be looking at this ratio for profit taking. Depending on strength, the next ratio can come into play.
- 1.618 – This is another level we will monitor when/if price approaches it.
Before I head to the trade we have been working with, find below the weekly chart of the very popular EURUSD Forex pair. Due to space limitations, I will work from Jan 2012 to give you examples but feel free to head much further back on any instrument.

After selling the rally, price breaks the confirming ratio (.786), hits the first profit target and after hitting the second target, reverses
This next chart is the rally after the low and sets up a long entry.
As you can see, price slams through the confirming ratio, slams through the first target, pushes above the second target and then reverses.

This chart shows we didn’t even hit the confirming ratio before price slams back towards the entry zone. Price forms a double bottom trading pattern, struggles through the confirming ratio before hitting our profit target to the pip before reversing course.
The EURUSD is currently heading to the downside setting up bigger swings and this chart shows some levels on the radar.

How To Draw The Fibs
For this method, we are simply measuring the swing INTO the setup and projecting the targets OUT OF the setup.
Look at this chart. The downward arrow shows the swing we are measuring assuming you trade pullbacks. This is the move into your setup. The move to the upside is what is projected.

Our Forex Setup
Using the same trade as the other articles, I have laid the Fibs onto the chart.
What do you see?
Was there any concern that the trade was in danger?

Price slammed through our confirming ratio and busted up through our first target, After about a day of sideways price action and a fake to the downside, price drove up to the final target. Price then dropped, interesting enough, right back to our confirming ratio.
Keys To Trading Success
- .786 – The one I watch to see how price reacts. A range is not an issue but strong reversal signals will have me taking action on the trade. Until price reaches that level, I am in set and forget mode.
- 1.272 – The first profit area and a high probability target once price breaks the confirming ratio.
- 1.618 – Once risk is reduced or eliminated, this is an great extended target.
I urge you to go back over your charts and see how this plays out in your chosen instrument. I will leave you with this chart of Gold and the first retracement after the March 2014 highs.

You will see price has bottomed out after the second pullback series right at the 1.272 profit area.
Good luck and let me know how the testing goes!
1 Comment
Comments are closed.
This is a very interesting article