- August 5, 2017
- Posted by: NetPicks
- Categories: Options Trading, Trading Article

You may not want to trade Options for a living but having options trading as part of your overall trading portfolio is a strong way to diversify your trading business.
Our approach to trading options will be a little different than what most traders are used to seeing and we credit our unique approach that has allowed us to profit in virtually any market condition.
- We use range bars which requires an instrument to move X price distance before plotting another bar. This keeps our charts clean and hides most of the useless price action but will show us when conditions are changing which allows us to profit
- We fine tune everything once every quarter so our system never breaks down even when market conditions are less than optimal
- There is no guesswork. All of our entries and exits print directly on the chart so we can see at a glance if there is action to be taken on one of our watch list names.
But we don’t only diversify the names we trade.
We diversify our option strategies as well.
You want to be a well-rounded options trader and that means being able to tackle more than just the simple buying of calls and puts. That is far too limiting to take full advantage of the power of trading options.
5 Ways I Can Profit With My Favorite Options Name
One of the best names we’ve been trading in the Inner Circle is Nvidia: NVDA
It’s a very active market, lots of volume, lots of open interest, and price action back and forth which is fantastic for any options trader.

We have a clear strong uptrend in NVDA and all signs point to an overbought market. I could do what most do and buy a simple put because I expect a big down move from an overbought market.
As mentioned in this trading post about the relative strength index, an overbought markets does not mean a reversal is imminent. A market can stay overbought longer than we think and can also work off the overbought condition by going sideways.
Using an options strategy that gives more potential ways of booking a profit was the way to go.
I sold the 167.5, 170 call spread (see red arrow) and I collected 80 cents. What that meant was I was selling the 167.5 call and I was buying the 170 call to make it a risk defining trade. I know what my maximum loss is right upfront. I had this tied up $170 of capital per spread to put on. That’s my maximum loss
A lot of times people get intimidated by options. They say, “Hey, that’s too complex. It’s too risky,” when the truth is that it’s actually a very safe way of trading.
Not only is my loss limited but there are a few ways I can book profits on this trade.
My break even point is the horizontal red line on the chart. It’s at 168.30. If price moved higher, lower, or sideways, it didn’t matter. As long as the close was below the red line, I book profits.
Price drifted without any strong bullish or bearish price action and I still booked a profit.
- I made money if Nvidia moved higher, lower or sideways.
- I made money if time decay added up
- I made money if volatility decreased.
5 potential ways of making money on that trade and it only tied up $170 of capital/spread.
I know, you’re saying that $38 profit, “That doesn’t look very impressive.”
Remember, I only tied up $170 of capital per spread to begin with. I could have put this on 10 times and I still only had $1,700 of risk. You can trade multiple spreads here and all of a sudden it starts to add up in a big way.
The big takeaway here: The market did nothing in terms of price action and I booked profits.

Current Market Conditions Demand Multiple Streams To Profit From
Keep in mind I had a complete sideways move here that I made money from. That has to get you a interested. Given the market environment that we’re in now you have to have multiple areas to make money from when trading options
It’s a requirement in this current environment.
Building on the idea of diversification, you must have different products available to trade. Having a watch list of Option products that meet your criteria for trading is vital for any long term success.
Don’t Need American Airlines To Take Flight To Make Money
It really doesn’t matter the chart that you look at, the market’s been very over-bought a good part of this year so you can look at American Airlines: AAL and say “It’s very over-bought and probably time to expect some consolidation in here or at least a pullback.”
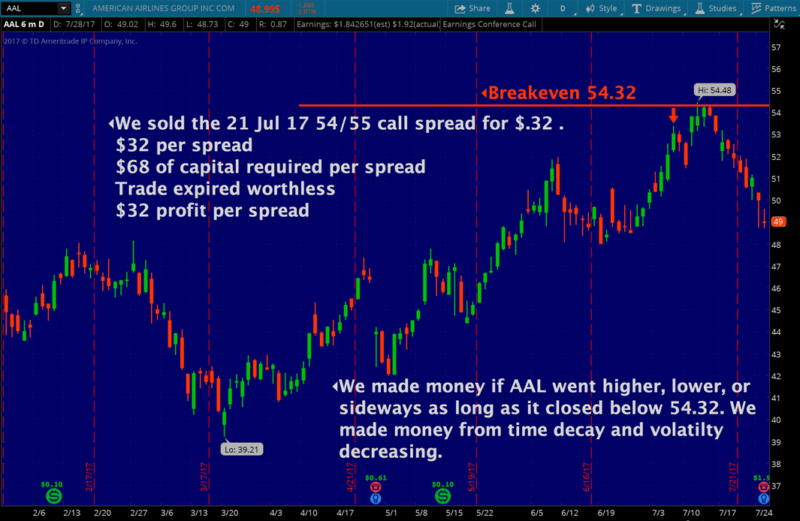
Instead of doing what many options traders will do, buying a long put to jump on the overbought condition and the potential downside move, I took a call spread.
I took a look at the 54, 55 call spread. I sold the 54 call, I bought the 55 call to make it a risk defining trade, and I collected 32 cents or $32 per spread to put the trade on.
You may be thinking $32 is not impressive but I only used $68 of capital. Put up 10X and you have less than $700 risk and like the NVDA trade, I will make money on this trade as long as it closes below my line in the sand.
I watched volatility decrease and time decay add up and still there were 5 ways to make money on this trade.
Here is how the trade played out:
- The market made a move to the downside
- I let the option expire worthless
- Kept my $32
- Paid no commission to close the trade
- Booked profit
10 Seconds Of Screen Time To Trade These Options Strategies
It doesn’t take a lot of time to manage any of the trades (or even to find them) I enter the trade and draw my red “line in the sand”. I come in and in literally 2 seconds I know if price action is below my break even point or not
As long as we’re below the break even point there’s nothing for me to do.
I don’t have to look and decide:
- Do I want to get out of this trade?
- Should I stay in longer?
- Should I phone a friend to see what to do?
I also don’t have to decipher 5 different trading indicators to tell me what to do. Looking back at my charts, I hope the first thing you notice is how clean they are. There is nothing getting in the way of the most important information on a chart – price.

“You Only Make Money Selling Options”
I’ve heard that statement many times and there are many people on the internet and in trading books that say you should only sell options.
Here’s my take on that:
It’s very attractive. I love to sell options, but I don’t want to back myself into a corner and say, “Hey, I’m only going to sell options.”
You know the market can make big directional moves as well and you want to have a good mix of products out there because ultimately no one knows what the market’s going to do next.
There are times when I want to buy calls and puts. I do want to make a directional bet. As long as it’s a part of my portfolio, there’s a lot of money to be made there.
The key point is why limit yourself?
Take advantage of the flexibility that options offer so you don’t miss out on some great trading opportunities. I love to sell spreads and what if we’re expecting the market to make a big directional move?
What if I have an opinion on what the market’s going to do next? What else could I do here instead of just selling spreads?
39% Return On Apple – No Guesswork
Let’s step back and take a look at how simple (but systematic) we keep our options trading so we don’t get bogged down on information that doesn’t add to our bottom line.
In our Inner Circle, we teach traders that having a set of mechanics that you can stay disciplined to, a set of rules that guide you every single day is the key to Options trading success.
Having a specific set of criteria we follow every single day makes training new options traders that much quicker (and easier).
Let’s say you were looking at this chart of Apple and wondering about a trading opportunity. As part of the Inner Circle of traders, you are very specific on what you want to see happen before you get into a directional trade.
Once the trading criteria is met: we’ve got our trade calculator that prints exact entry points, targets and stops for us in real time.
- Blue dots are long trades
- Pink dots are short trades
- No emotion or guesswork
All the big questions traders ask, where to get in and out, are answered for you and plotted right on the chart.
Here on Apple you can see the blue dots with two targets up above and the stop down below: I bought the 140 calls for $734 per contract.
A little bit pricier than I like but I traded more conservative, went further out in time with the options contract because the market was moving a lot slower.
We drifted to the upside, but it was enough to come up and hit the full target booking a $286 profit, almost a 40% return and we were in and out in about a week’s time.
Typical holding time, three to five days on many of our products where we’re not looking to day trade. We’re just looking to come in and check all the charts in about 20 minutes a day or less.
How can we check the charts so quickly?
- We have the trade calculator here printing the entries and exits.
- We’ve got a set of rules that we can follow.
- We have a watch list of products we focus on instead of scanning the entire universe of possibilities
It allows us to get in, get active in the markets and then move on with the rest of our day. Very powerful approach.
Why Our Systems Embarrass The Others
There’s a lot of people out there that say, “Hey, I’ve got a set of rules that you can follow that will allow you to make money in the markets.”
We’ve got some different rules built in that are very different, the first being the chart type that we’re looking at.
Most of you are probably using a time-based chart. It could be an hourly chart. It could be a daily chart. The problem with those is if the market’s not moving, that chart still has to print bars or candles every set amount of time. That can lead to a very choppy, messy looking chart because we know the market’s not always moving.
That Apple chart above?
It’s actually a range chart of one dollar, so every time Apple moves $1 and one cent from high to low, it prints a candle. That could take five hours for a candle to print, it could take five days. It just depends on how active the market is.
Now we’re taking our focus off of time and we’re shifting it to purely looking at price action.
There’s a formula that we look at that tells us the exact range setting we should be using on every name on our list, so there’s no guessing there.
We’re really able to fine tune our chart to the specific symbol that we’re look at, because we know Apple will move different than Google. Google will move different than Bank of America so we really want to fine tune things to each individual name on our list and we also understand market conditions will change over time as well.
You will find our system extremely powerful without wasting the day trying to find the perfect product. It’s all done for you.

ETF Trading – Nothing Changes
I love to trade gold. Gold and a lot of the commodities have been pretty active this year. Even though stocks haven’t really had two way movement that some of these commodities have had.

Here on gold we’re taking a look at the pink dots now (that tells us we are looking to the downside, remember?). We know the markets will move up or down throughout the year.
We don’t know which way we’re going here the rest of this year, but we know it’s going to probably swing back and forth so you want to have the opportunity to play that movement back and forth.
I bought the 122 puts (red arrow, pink dots) for $259 per contract. We came down, we hit that full target, booked $122 profit. That’s a 47% return.
We triggered in on June 9th. We got out of this trade on the 20th. We were in and out in about 11 days. That’s actually one of the longer holding times we’ve had on GLD, 11 days. So in 11 days the trade gave a 47% return with only 20 minutes a day looking at charts.
Trading Energy? Our Approach Stays The Same
We’ve seen a lot of activity in the energy markets this year. Let’s take a look at Halliburton : HAL.
We would all love to trade Apple and Google and Amazon every single day, but is that really smart? I would much rather spread my risk across different areas because again, no one knows what the market’s going to do next.
No one knows what area’s going to really pick up. If you can spread your risk to different areas, you’re going to be far better off for taking that approach long term.

Do you remember what the blue dots mean? If you answered “long side”, you are learning how simple our approach is across all markets.
I bought the 40 calls for $360 per contract. Price hit that full target, gave $170 profit or a 47% return. In and out in about a week’s time.
Remember: We are only looking at the charts 20 minutes a day and placing the trades that our approach is telling us to.
Winners. Losers. Win Rate
These are the stats that many traders focus on and our approach in the Inner Circle turn in respectable numbers:
- Winning trades in the 40-100% range
- Losing trades in the 20-30% range (smaller than our winners!)
- Win rate with our long calls and puts is 66% which is a requirement to make our watch list long term
Facebook’s Not Just For “Likes” And Selfies
Traders love trading Facebook : FB. We just had a move to the upside that we were able to catch as well. Again, you can see the blue dots on the chart outlining everything for us.

I bought the 136 calls, $432 per contract. Price rallied, hit the target and the trade closed out – $138 of profit, 32% return.
You should be able to see the potential here: these profits add up to where you’re replacing an income or supplementing an income.
The key, having a good mix of different stocks and ETFs on your list, having that diversified list of products, but also having a diversified list of different strategies that you can go to.
Our Inner Circle Members Are One Step Ahead Of You
Everything you’ve read and seen here is what our Inner Circle members saw all these setups in real time. They knew exactly how to trade these products to maximize the profit potential each one offered.
Options Express Service – Text and Email
Even better, the short call spreads that I talked about here earlier on Nvidia and on American Airlines, as part of our Weekly Options Express Service are actually sent out via text and email alerts whenever we place a trade. We’re going to do the work that’s required and keep you up to date as we go through those alerts.
Regardless of where you’re at, if you’re on the go throughout the day, you don’t have access to a computer, great way to stay active in the markets.
So if we find a trade idea that we like, if we’re going to enter into the position, before we do so we’re going to send out that alert to you telling you exactly where to get in.
You aren’t left hanging because when we exit out of the trade, whether it be a couple days later or a week later, we’re going to send out an alert as well telling you where to get out.
The calculator that shows you all the setups? You’re going to be able to download that right to your charts.
You’re going to have access to all of these powerful tools that I showed you here today right inside of your own platform so you can be in complete control of your trading.
Weekly Options Are Our Focus
We do like to focus in on the Weekly Options typically with seven to 21 days left. We’re trying to take advantage of the short term options that have a lot of time decay working in our favor and we typically shoot for around six to 10 trades a week depending on how active the market is.
We never try to force any part of the trade. We’re taking what the market’s giving us. Combine that approach with our directional trades there’s just a ton of profit potential there.
Trading option should be a part of everybody’s trading business.
Options don’t have to be risky. They’re one of the safest areas out there. They’re the most flexible financial product out there.
2 Comments
Comments are closed.
Very simple explanation .
I have lernt a lot
Thanks for the feedback. Let us know if you have any questions that we can help with going forward.