- October 23, 2023
- Posted by: NetPicks
- Category: Trading Article
In the world of trading, support and resistance levels act as the market’s natural floor that can indicate where prices may tend to pause or reverse. Learning how to find support and resistence levels starts by studying past price behaviors, noting areas where prices have historically been bounced from, and by using tools like trend lines, horizonal support/resistance lines, or Fibonacci levels.
 Recognizing these levels is important because they offer traders clues about potential future price movements, helping them make better decisions and manage risks effectively.
How To Find Support and Resistance Levels
Finding support and resistance levels can be done in many ways and you could question each of them. How do you know your lines are any better than random? Here’s a fun test to do:
- Turn off your candlesticks or bars on your charts
- Start drawing random horizontal lines
- Turn your candlesticks back on
What are you seeing when you look at the chart?
- Do you see where price has bounced from your random lines?
- Do you see where price bounced a few times?
- Do you see where support and resistance switched roles?
If random lines seemingly reject price, how will you make sure your lines are valid?
One way to determine your support and resistance levels is to use basic market trend structure.
- A market in an uptrend will produce higher highs and higher lows.
- A market in a downtrend will produce lower highs and lower lows
- A market in a range will produce both
“Usually, a support level is identified beforehand by a previous reaction low,” and “a resistance level is identified by a previous peak” (Murphy 1986)
Understanding how to accurately find support and resistance levels is important for them to have any use. These levels serve as critical markers for traders, helping with their entry and exit points, and offering insights into potential trend reversals or continuations.
Let’s dive into the nuances of some of the most effective techniques to pinpoint these crucial levels.
Traditional Horizontal Levels: Connecting Highs and Lows
Basics of Horizontal Levels
Traditional horizontal levels are foundational in technical analysis. By connecting the most obvious highs (resistance) and lows (support) on a chart, traders can identify key areas where the price has historically found support or faced resistance.
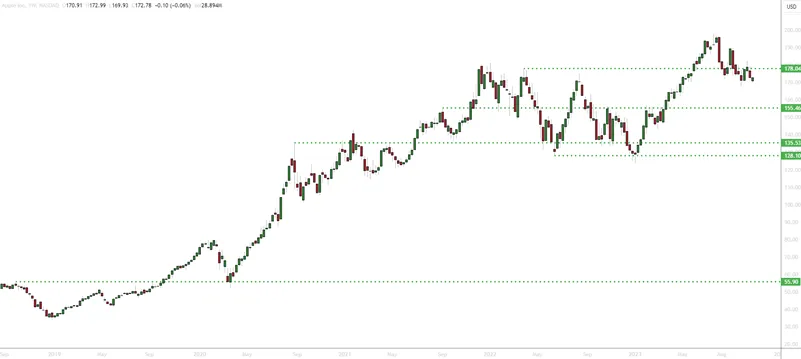 For instance, if a stock price has bounced back from a particular price level multiple times, it indicates a strong support level. Conversely, if it has been repelled from a certain level repeatedly, that’s a resistance.
Tips for Drawing Horizontal Levels
Always use a clean chart and start with higher time frames, like the daily or weekly charts, to identify major support and resistance levels. The more times a price touches a support or resistance without breaking it, the stronger that level is.
Psychological Levels: The Role of Round Numbers
The Power of Round Numbers
Traders often place orders at round numbers, making these levels more significant in terms of support and resistance. For instance, levels like $10, $20, or $100 often serve as psychological barriers. Why do they matter? These levels are easy to remember and are often used as benchmarks. When a stock price approaches a round number, traders anticipate a reaction, making these levels self-fulfilling.
 Trading Strategy
 Trading Strategy
Consider setting orders slightly before or after round numbers to avoid the rush and get a better entry or exit point.
Swing Highs and Swing Lows: Understanding Candlestick Wicks
Deciphering the Wicks
The wicks of candlesticks represent price extremes. A swing high is a candlestick with at least two lower highs on both the left and right of a high, and a swing low has two higher lows on either side. Swing highs and lows are pivotal for trend identification due to the stair stepping structure that price makes during trends.
They can indicate potential trend reversals, making them invaluable for traders as price breaks a swing low after a series of swing highs. Always look for confirmation because if a swing high is followed by a bearish candle, it might indicate a potential downtrend.
Fibonacci Retracements: Drawing Levels Using Fibonacci Ratios
The Golden Ratio
Derived from the Fibonacci sequence, these retracement levels (23.6%, 38.2%, and 61.8%) represent potential reversal areas in the market. By drawing horizontal lines at these percentages from a major peak to a trough, traders can anticipate potential bounce-back levels.
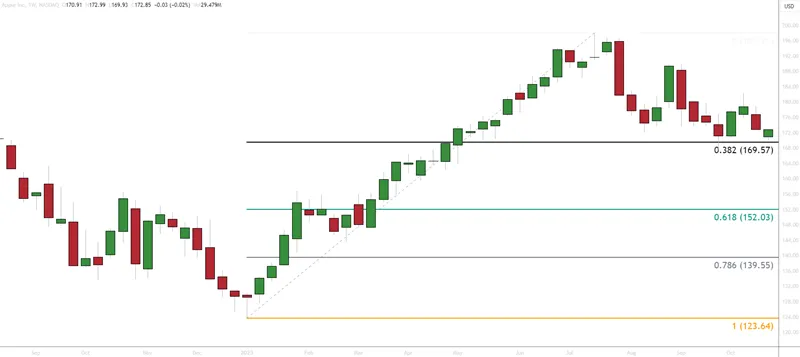 For instance, if a stock drops from $197.96 to $90, a 38.2% Fibonacci retracement would be at $169.57, indicating a potential support level.
Identifying Strong vs. Weak Levels
Levels on a chart do not always carry the same weight. There are levels that seem to provide a “stronger hold” and this is usually due to the recent price action surrounding the level. I want you to see a breakdown of how I locate levels whether trading breakout or pullback strategies.

- Some type of trending pattern and this example is an uptrend
- Once a swing high is put in (HH), the price rejects from the price point (resistance) and then exceeds resistance, we will mark that area as former resistance and POTENTIAL support.
- At the point marked “A”, you can see we have a higher low and then a lower high. This negates the uptrend pattern and you can see price has put in a triangle pattern.
- At the point marked “B” the price holds inside of highs and lows and it’s labeled a trading range
- Price breaks lows of range and rejects off previous resistance which has now produced a support level
You will want to note that price will not always return to a former “reaction low” as mentioned by Murphy in the quote above.
There will be times when price will return to the former area of resistance and that zone will act as support as buyers enter the market.
This is a simple and objective price action method to identify your support and resistance zones using a pure market structure. You can also use prior day highs and lows for your financial instrument but with markets heading to 24-hour trading (Forex is already there), you may want to define the time you use for open and close such as 5 P.M. New York.
Don’t get too caught up in exact price points with your lines. Remember these are zones. Price is rarely perfect.
Psychological Significance Behind Support and Resistance
Trading based on support or resistance levels alone is like trading with blinders on. It’s easy to identify specific prices that have historically demonstrated their value as support or resistance and the temptation which follows is to take a trade at the price when the level is revisited.
 Every trader, whether seasoned or a novice, has experienced, when a stock price nears a previously established high or low, the thought of “what’s next”? It’s not just about the numbers; it’s about the collective psyche of the market participants. This is the psychological reason for support and resistance levels.
At its core, the market is a reflection of collective human behavior. When a price approaches a previous high, traders remember the past. They recall the resistance faced, the selling pressure that emerged, and the potential losses incurred. This collective memory, often driven by fear of repeating past mistakes, can halt a bullish trend in its tracks, confirming that price point as a resistance level.
On the flip side, when prices drop to a previously established low, a sense of “is that far enough” begins to happen. Traders remember the rebounds, the buying opportunities, and the gains that followed. This instills a sense of optimism, a belief that the instrument has found a bottom, leading to increased buying activity. This collective optimism creates a floor, or support level, where the price seems to bounce back.
It’s a combination of collective fear and greed, hope and despair, and it plays out every day in the charts we analyze.”
Problems With Drawing Trend Lines For Support and Resistance
I know some chartists will challenge me on the use of trend lines but you will find that many long-time chart technicians have forsaken the trend line not only for support and resistance but also the chart patterns that use them. Why?
Let’s explore an example and look at trendlines and the main issue with using them for price patterns.

After two peaks, I am able to draw a trend line to connect the points. Traders that play breakouts of trend lines will monitor price as it breaks the line. In this example, each break of the trend line rallied but stopped dead in the tracks right near the horizontal resistance line. If you were a long trader this would have caused you grief as the market continued to pull back against you.
It wasn’t until the price consolidated under the horizontal resistance line (a bullish sign) that we eventually got a strong break of resistance for a long trade. That’s not to say you can’t use trend lines in this manner. Just be on the watch for horizontal support and resistance levels that may cause a speed bump or detour.
Support And Resistance Zones Must Eventually Break
However, if all levels were going to hold all of the time the markets would never move. So the question is if you are going to enter at levels of support or resistance, which do you choose and when are they valid? One determining factor you may use to determine a “strong level” is the amount of time the price is rejected at each data point.
That is not a good trading method.

Hits on a support or resistance level actually weaken the level over time Each time the price revisits a level, stop loss orders accumulate underneath the zone as you can see by the increasing line thickness.
These make prime areas for an influx of order flow as these orders are triggered. Depending on the number of stop-loss orders beneath the support line and the number of breakout traders standing by, the price can move fast and hard away from the level.
You can note by the green circles that once you start to see the price not rallying far from the level or the price begins to base at the zone, extra caution must be taken if you are considering a trading opportunity.
In order to trade at a level it’s important to see context, confluence (ideally other reference points aligning), and the right sort of trading activity on approach, all working together.
Moving Averages To Define Dynamic Levels
We’ve all heard about moving averages such as the 50 period average, the 100, 200, and even 20 periods. Many traders believe that these lines act as “dynamic” support and resistance levels. Dynamic as in they change with price.
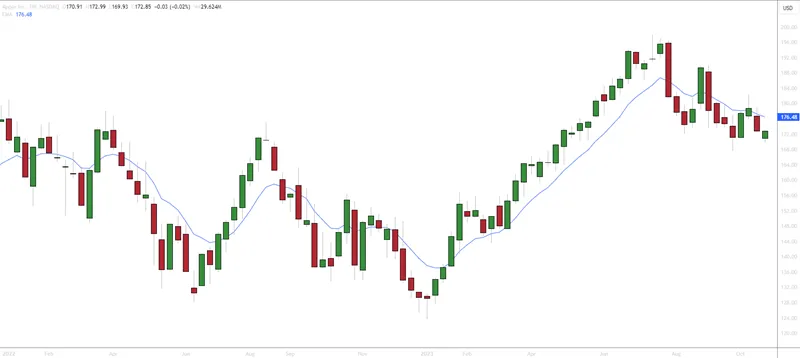 The truth is the calculation of the moving average needs, as an example, 50 data points which are generally the closing prices. As the price begins to lose momentum, the range between closing prices gets smaller. The moving average will then draw closer to price giving the illusion that it is supporting price. It isn’t.
It is just the moving average calculation taking place as the closing prices between each day are not as wide as they were previously.
How To Trade Support and Resistance Levels
Since we understand that all support and resistance levels can break, how do we take a trade from the level? Remember, support and resistance zones are market reference points that allow you to have some structure to your trading decisions at locations where there is potential for price movement.
You don’t have to trade support and resistance zones to get the benefit of them.
Seeing how price reacts to these points can be just as valuable depending on your trading strategy. Once you’ve determined support and resistance zones that you will keep an eye on, the next stage is to watch for signs that the level will either hold or fail.

- A strong drop in price and a long tail candlestick (pin bar, kangaroo tail) reject the previous resistance now acting as a support level. We’d call this minor support since price has not visited prior to this event.
- This is the first peak but highlights a bearish candle that takes out the real body of the bull candlestick. This is a move you can trade
- Another rejection of support is now called major support since it has rejected prices more than once.
- Engulfed candlestick at major resistance
- Price consolidates at support with an obvious resistance line.
- Price then consolidates at the top of the range which indicates bullish intent. You can position it inside this smaller range.
- Lack of bullish momentum at resistance as shown by smaller candlesticks.
- Range with obvious support and resistance levels. A strong break of support and price pulled back to test. After the price breaks all previous support, a pullback trade sets up another shot to the downside.
This one-chart example has shown many candlestick formations that you can look for in these zones.
False Breakouts Of Zones Are Common
Many breakout traders get nailed when price tests a level, appear to want to break, and then simply snap back up. These are called false breakout or, a more accurate label, failure tests.

In this chart, the price has run into resistance and pulled back. You know that traders have been going short or exiting longs because the price had not broken through. Remember what we talked about earlier? Protective stops are accumulating just beyond resistance and the traders on the sidelines are waiting for price to break resistance so they can go long.
At the right of the chart, the price runs from the low end of consolidation, and after a small battle as indicated by long lower shadows, the price pops the resistance area at the black arrow.
Price had a decent run but eventually slammed back almost closing below the open. Is this the sign of a successful breakout? No. By the looks of the massive bear candlestick that wiped out 3 days of gains, those that went long are getting hammered.
After a brief consolidation, hopeful bulls see the end is near and the second huge momentum candlestick indicates the probability of other shorts entering the market and bulls finally exiting their position.
False breakouts of support and resistance, even if you don’t trade them, tell a story that the zone is still of interest and acting as a barrier to price. That may aid you in taking a trade short in virtually any trading strategy.
Shorting At A Support Zone Example
The general rule is not to short into support or buy into resistance.
That’s a rule that may be ignored and price action will dictate behavior (this happens to be my favorite setup).

- Strong momentum moves to the downside and price rallies giving us a support line and resistance line.
- Price drops back to support at the first green circle but buyers hold the move
- The second green circle shows sellers stepping in strong but the slight drifting upwards after shows bulls holding on
- Price drops and begins to consolidate
- The last green circle shows the price dipping below the support level of the range and popping back inside.
- Price is unable to gain traction to the upside
This is a prime location to enter the trade!
Price action has shown you that in this critical area, the bears are the ones holding the cards.
Your stop would not be placed just above the zone (remember stop runs?) but you may use an ATR stop as an example.
You are positioned before the break which means:
- Before stops are triggered
- Before the breakout traders step in
It is not uncommon to ride the wave of momentum and be up a considerable amount long before others get wind of the trading opportunity.
Identify Support On Higher Time Frames
It is a good practice for traders to examine higher time frames for levels close to the current price. Identifying support or resistance levels on a time frame 3-5 times higher than your trading time frame can help identify roadblocks to price.
As an example, if you get a strong buy setup on a daily chart, take a look at the weekly or monthly chart to see if overhead resistance is close by. Higher time frames will have fewer levels than smaller time frames which means they will be obvious to other market participants. Going long into a resistance zone could make for a painful trade as the price is rejected at highs. This may be a better place to look at a short trade.
Conclusion
The assumptions that either levels ‘work’ all the time or they are non-existent, are flawed. Once you understand what they really are, you’ll see just how useful they can be whether you day trade or swing trade regardless of the time frame chart you are using.
Support and resistance zones will either hold or break. That’s it. Find your own method of determining which one has a higher probability of occurring and take action.
Keep in mind that if a level breaks, you don’t expect the price to come roaring back inside of the level. You expect pullbacks into the breakout zone to be weak. This is where understanding what a failure looks like at the zone.
Trading support and resistance is a viable part of a trading strategy that includes risk management and trading psychology. Practice locating and drawing your levels and monitor the behavior of price when the line breaks and when it holds.
Hands-on is the best teacher so crack open your charts and start perfecting your use of support and resistance trading.
FAQ
What are support and resistance levels and why are they important in trading?
Support and resistance levels are tools in technical analysis used by traders to see where prices may run into trouble. Support is a price level at which an asset tends to find buying interest, preventing it from falling further. Resistance is a price level where an asset often faces selling pressure, preventing it from rising further. These levels are important because they indicate areas of potential price reversals or consolidation. Traders use them to plan entry and exit points, set stop-loss orders, and gauge market sentiment.
How can I identify support and resistance levels?
Support and resistance levels can be identified using various methods:
-
- Price History: Analyze historical price charts to locate areas where prices have reversed or stalled in the past.
- Trendlines: Draw trendlines connecting consecutive lows for support and consecutive highs for resistance.
- Moving Averages: Exponential moving averages can help identify dynamic support and resistance levels.
- Fibonacci Retracement: Use Fibonacci retracement levels to identify potential support and resistance zones based on key ratios.
- Volume: High trading volumes near specific price levels can indicate significant support or resistance.
Can support and resistance levels be used as entry and exit points for trades?
Yes, support and resistance levels are often used as entry and exit points. Traders might enter a trade when an asset approaches a support level with the expectation of a price bounce, or they may exit when it nears a resistance level to take profits. Additionally, breakouts (when prices move decisively through a support or resistance level) can be used as entry signals.
What are some common techniques to pinpoint support and resistance levels?
Common techniques include:
-
- Horizontal Levels: Identifying price levels where an asset has reversed multiple times.
- Trendlines: Drawing trendlines to visualize dynamic support and resistance.
- Moving Averages: Using moving averages to identify levels where prices often react.
- Round Numbers: Psychological levels like round numbers often act as support and resistance.
- Pivot Points: Calculating pivot points based on the previous day’s high, low, and close prices.
How should I interpret market reactions to support and resistance levels?
When an asset approaches support, a bounce may signal buying interest and potential for an uptrend. On the flip side, near resistance, a reversal or consolidation could indicate selling pressure and a possible downtrend. Breakouts can be significant, as they suggest a potential change in trend direction. It’s essential to consider other technical indicators and market context when interpreting these reactions.