- February 7, 2022
- Posted by: CoachShane
- Category: Trading Article

The Heikin Ashi technique is a Japanese candlestick chart-based technical trading tool used to represent and visualize market data. It’s used to identify market trends and predict future prices. The Heikin–Ashi method uses average prices that help to filter out market noise. It literally means “average bar”.
While you will never know the current price of the instrument at any one time (which could be a problem for day traders), there are other useful benefits of using Heikin Ashi charts that we will discuss.
A traditional candlestick chart will calculate the high, low, open, and close which makes the main difference between (HA) Heikin Ashi candles and other types of charts, being the plotting of the average price.
Heiken Ashi Chart Technique
The lack of market noise makes it easier to see where the market is going. The trading strategy helps traders identify when they should hold on, pause, or identify if a trend has reversed. Traders can adjust the size of their positions according to the market conditions, i.e., whether they want to avoid making losses or lock-in profits.
For a moment, try to forget what you know about Japanese candlestick charts because some things are counter intuitive.
As an example, a long upper shadow on a green Japanese candlestick is considered weakness.
That is not the case with Heikin Ashi charts. Let’s do a candlestick vs Heiken Ashi comparison in the chart below.
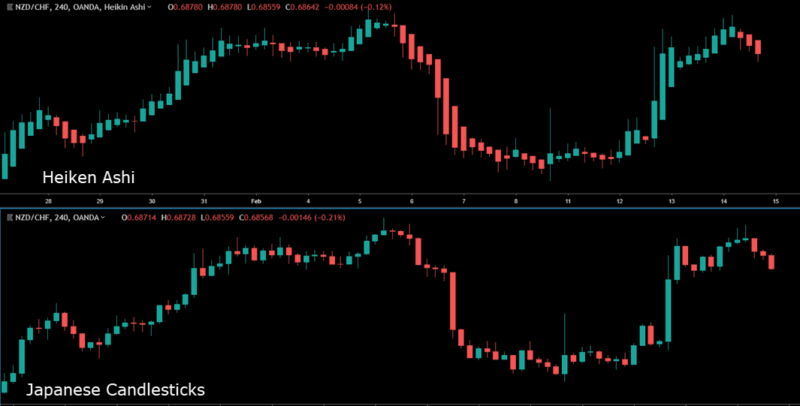
Since the Heikin Ashi chart is an excellent trend determination charting method, let’s outline what to look for when considering trend direction.
During a downtrend, the color of the Heikin-Ashi chart candles is usually red. During an uptrend, the color of these candles is usually green. However, different colors are also used to suit the trader. A change in the color of a candle indicates a potential change in the direction of the market.
Traders often struggle to interpret and identify trends when using traditional candlestick charts because they change colors from green to red and back again. The Heikin Ashi chart removes the noise and shows consecutive colored candles, depending on the market state, making them that much easier to interpret.
Whenever you see the colors flipping from red to green in a short time period, you could be looking at a ranging market and this is a sign to step aside.
One important thing to note is I would only consider a strong bull trending market once the green candles have zero lower shadow length.
The opposite is true for a strong bearish market.
How To Calculate Heikin Ashi Candlesticks
Most charting platforms do the work for you and calculate the Heikin Ashi chart for you.
For those using a platform like MT4, you can download a Heikin Ashi indicator here. If you use Metatrader, you should be familiar with adding an indicator to a chart.
The formula for the HA chart is as follows:
Open = (Open of Previous Bar + Close of Previous Bar) / 2
High = Highest value of High, Open, Close
Low = Lowest value of Low, Open, Close
Close = (Open + High + Low + Close) / 4
You can see by the calculation that there is lag time between real price and the price shown by a Heikin Ashi chart. It is similar with trading indicators that rely on past price to plot so you can see why the calculated HA candle will not be the exact exchange price.
There is a difference in price between the bar chart or candlestick chart compared to the Heikin Ashi chart. Understand there is a price difference so understand you be entering trades that you would not if your chart was up to date.
Remember, the Japanese candlestick chart will show you the exact price of the instrument you are trading. The HA chart will show you a calculated average that uses data from the previous candle plot.
HA Indicator Signals
There are many ways to put together a Heiken Ashi trading strategy and that also includes determining not only trend direction, but also trend strength.
Determine Trend Strength
Due to the smoothing action of these charts, small consolidations and corrections are not as prevalent as a candlestick chart. This can allow a trader to not get shaken out on the noise of market movement.
Bullish Trend: Traders will look for a series of green candlesticks without a lower wick. This not only indicates an uptrend, but due to the lack of lower shadow, it is a strong trend.
Bearish Trend: You’d want to see a series of red candlesticks without an upper shadow. This will point to a market in a strong downtrend.
Potential Trend Reversal: A doji candlestick with long upper and lower shadows can indicate the potential for a trend change.
We can use chart patterns to get involved with each market condition.
How To Use Heiken Ashi Candlestick Patterns
Chart patterns include patterns such as flag and triangles. They are pretty easy to see using this style of charting.
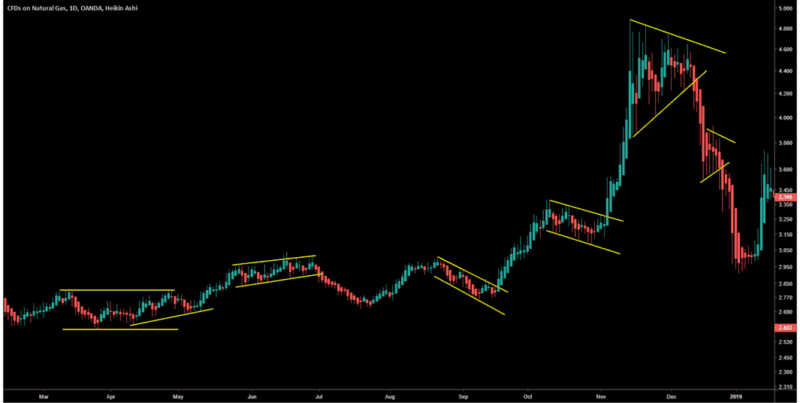
On this chart of Corn, we have easily defined ranges, complex pullbacks (flags), triangles, and you would trade these the way you would on a Japanese candlestick chart.
For Example: A triangle in an uptrend would be considered a continuation pattern after a period of consolidation. A trader would look for an upside break for a long continuation trade. In a downtrend, I’d be looking for a downside break.
Heiken Ashi Strategy For Day Trading
There are a few ways to use you can use a Heiken Ashi intraday strategy and that can include strategies that use technical indicators.
To keep things simple, let’s look at a strategy that uses trend direction determined with price action, common chart patterns, and the doji reversal candles of the HA chart.
Here we have a chart of the one hour EURCAD chart. You could go lower with other instruments but I prefer one hour charts if intra-day Forex trading.
Setting up the context, we can see on the left a strong push to the upside and a range formed with many inside candles.
Remember, we are looking to the direction of the breakout from any pattern and at this point, a downside break could mean the beginning of a down trend.

- Range formed and smaller HA candles are forming with rejections off of the resistance zone of the range. Doji candles with a small body are being formed and we get a break to the downside the forms a double bottom
- Pullback trades actually have an edge in the market and for this potential down trend to confirm via price action, we need a lower high put in. As price pulls back, doji candles form and we can draw a trend line. The break of the trend line and the first red candle to form without a upper shadow, we take a short position.
- Lower low is made and price pulls back. Doji candles form and we draw our trend line. Price breaks and we short the first red candle with no upper shadow
- Another lower low and price pulls back to make a rough double top. The green candles get smaller and a red doji plots on the chart. Trend line break and short taken
- Price forms a higher low and while price pulls back with higher lows, the green candles begin to print with upper and lower shadows unable to stay above the resistance. Breakdown occurs
- Price forms a range with many dojis. Price breaks out of the range and bases at the top of the resistance zone and plots a doji. Trade can be entered when price breaks high of previous 2 candles
I have not added in stops, trailing stops or price targets on this chart. You will need to use the actual price of the instrument at the time you note these setups.
You can see that using technical analysis helps make Heikin Ashi useful for a day trading strategy.
Multiple Time Frame Trading
For those not familiar with multiple time frame trading, here is what you should know:
- You have a higher time frame chart where you consider trend direction and any market structure
- You have a medium time frame chart where you do your technical analysis and hunt for trade setups
- You have a lower time frame chart that you use for entries for the setups found on the medium time frame
Heiken Ashi charts are great for having you on the right side of the higher time frame trend which is a good approach for swing trading.
This is a day trading setup for crude oil using the 60 minute time frame for trend and 15 minutes for trades. I am not using a lower time frame to time entries. It is the trading chart period.

On the left chart, you can see strong down move in play and many people would want to short. Glance at the hourly chart (#1) which is showing very long shadows which is weakness.
While not visible well on this chart, at #2 all the red candles have upper shadows which is weakness and when combined with that extra large shadow, longs are the better probability on the lower time frame.
The left chart on the third arrow shows strong momentum to the downside with a green Japanese candlestick putting in a lower shadow. Look over to #3 and our green candles have no lower shadows and the upper shadows aren’t very large. The one hour chart is telling you to consider longs even with the strong 15 minute chart pullback.
Wrap Up
Let’s touch on a few important facts about Heikin Ashi chart that we have already covered
How Is The Heikin Ashi calculated?
It is a calculation that takes into account values from the previous day and uses an averaging formula to plot today’s candle
What is the difference between Heiken Ashi and candlestick charts?
The Japanese candlestick plots actual price values while the Heikin Ashi candlestick uses averages and smooths out price action
How to use Heikin Ashi for intra day trading?
You can use them much the same as regular candlesticks to trade off of. You can consider using HA as a trend determination charting method.
Biggest drawback?
Each candlestick is an average price which can make it difficult to find exact price entries. Many traders will use the smooth look of HA charts for patterns and trend. They will then switch to traditional charts to time their entry.
Related Teachings
Hope you enjoyed learning how to use Heikin Ashi charts for your trading. You may find the content below to be a good resource as well.
4 Best Swing Trading Indicators