- May 17, 2017
- Posted by: NetPicks
- Category: Trading Article

Exchange-traded products (ETPs) have grown in popularity as more products have become available and more traders have become aware of their benefits.
ETPs look like stocks, trade during market hours on stock exchanges, and provide similar trading opportunities including order types (market, limit, stop, etc.), short selling, and options.
How are ETF’s different than stocks?
Shares of ETPs do not represent shares of ownership of a particular company like stocks do, but represent shares of a constructed product, similar to that of a mutual fund.
Like any instrument we trade, we need to understand what we are trading in order to better appreciate the opportunities and risks they present. This is particularly true for positions that are held for more than a day.

Trading Stocks
When we trade stocks, we are better traders when we know something about the fundamentals of the companies behind our stock trades. We pay attention to when companies report earnings and post dividends.
Forex Trading
If we are Forex traders it makes sense to know something about the economies behind the currencies we trade and be aware of important news events that can impact our positions.
Futures Trading
With futures trading we need to know the specifications of the contract we are trading, and be aware of the maximum amount by which the price of the commodity futures contract may advance or decline in one trading day, known as limit up or limit down.
In the same way, a better understanding of the ETPs we trade will make us better traders.
History Of Exchange Traded Funds
The first ETPs were exchange-traded funds (ETFs) which began trading in 1993 with the introduction of Standard & Poor’s Depositary Receipts, known as SPDRs or “Spiders”, with the trading symbol SPY. This ETF was established to track the S&P 500 stock index as a way to allow investors to diversify their portfolios.
Prior to this, investors looking for diversification had to purchase multiple stocks, or invest in mutual funds, which have the disadvantage of trading just once per day after the close of the markets.
Diversification is a risk management technique that mixes a wide variety of investments within a portfolio. – Investopedia
SPY became the largest ETF in the world, and was soon followed by many other index ETFs.
Barclays Global Investors introduced global markets in 1996, with what is now known as iShares MSCI Index Fund Shares, giving stock investors easy access to global stock markets.
Since then ETFs have proliferated, and now include funds that track specific industries, markets regions, sectors, commodities, bonds, futures, currencies, and even market indicators such as volatility indexes.

Leveraged, Inverse, and Managed ETFs
Leveraged ETFs amplify the returns of the underlying by moving a multiple (typically 2:1 or 3:1) of the daily change of the underlying index, currency, or commodity. For example, a leveraged index fund with a 2:1 ratio will have as its goal to move 2% in one day if the underlying index moves 1%.
Conversely, if the underlying should drop 1%, the leveraged ETF will fall by 2%. Inverse ETFs move opposite the underlying.
With these ETFs, the fund goes up as the underlying goes down and vice versa. These funds are perfect for IRAs, where shorting is not permitted, and where the investor wants to take advantage of dropping prices.
There are even leveraged inverse ETFs which move a multiple of, but in the opposite direction to the underlying.
The most recent innovation in ETFs occurred in 2008 when the SEC approved actively managed ETFs.
These ETFs allow fund managers to make changes to the underlying mix of securities on a daily basis, and therefore provide mangers more flexibility, but these funds also have more management fees associated with them.
ETFs offer the investor;
- diversity
- low expenses
- tax efficiency
Today, with over 1000 ETFs available with different objectives, it is even more important that the investor understand the product.
How Are Exchange Traded Funds Constructed?
ETFs are created by fund managers who determine the objectives of the fund, write a prospectus which outlines the details of the fund, and determine which securities need to be held within the fund.
For stock index funds, these securities typically consist of the stocks that represent the underlying index. Other funds hold assets like:
- Bonds
- Currencies
- Commodities
Some funds, like leveraged and inverse ETFs, may need to hold “riskier” securities that consist of futures, options, and other derivatives that are required to achieve the objective.
Once the assets of the fund is determined:
- Fund managers create the shares of the ETF for sale to large institutional investors
- Continue to create shares as demand increases (or buy them back as demand decreases).
These large institutional investors then make the shares available on a stock exchange, act as liquidity providers and market makers, and thus make sure that the net asset value of the ETF closely matches the desired underlying assets.
Institutional investor is a term for entities which pool money to purchase securities, real property, and other investment assets or originate loans. Institutional investors include banks, insurance companies, pensions, hedge funds, REITs, investment advisors, endowments, and mutual funds. – Wikipedia
The more complex the construction of the ETF, the more difficult it is for the fund manager to accurately track the underlying index. This is known as tracking error, and is more common with leveraged and inverse funds.
Be aware that there are management fees that need to be charged to the fund, and derivatives, such as futures, have a cost to carry, both of which place a drag on the performance of the fund. There is also a slight risk associated with the fund manager.
ETFs are structured such that the shareholder owns shares of a basket of securities.
Should the ETF provider go bankrupt or shutdown the ETF, the shareholder will usually receive cash for the market value of the shares owned, or in some cases an actual distribution of the basket of securities if the position is large (typically over 50,000 shares).
Some ETFs issue K-1 tax forms that are required to be filed with U.S. federal income tax each year. If you are not interested in having to file these forms, then consider avoiding ETFs that issue K-1 forms.
Exchange Traded Notes
The other type of ETP is the exchange-traded note, or ETN. ETNs differ from ETFs in that they are unsecured debt instruments issued by major banks.
As debt instruments, these funds do not actually own assets like an ETF, but promise to pay the amount tracked by an index.
The largest ETN based on assets is Barclay’s iPath Dow Jones Commodity Index (DJP). The goal of this is to track the performance of commodities with an allocation of 30% energies, 21% grains, 19% industrial metals, 12% precious metals, 2% livestock and 16% other.
You might think that by owning shares of this ETN you would own commodities with this allocation; however, this allocation is used only as a measure for performance. An investor does not own any commodities, only a promise from Barclays to pay the investor the theoretical allocation of the commodity index.
Since ETNs are unsecured debt instruments, should the provider should go bankrupt, the investor would not receive his or her investment back. This may sound unlikely, but it does happen.
After the failure of Lehman Brothers in September 2008, trading was halted on a number of ETNs that they had issued, and they soon became worthless. The same thing almost happened to Bear Stearn’s ETN holders before JP Morgan stepped in to purchase the company.
Barclays provides some of the more popular ETNs including the iPath Dow Jones AIG Commodity Index (DJP), iPath S&P GSCI Crude Oil (OIL), and iPath S&P 500 volatility index VIX (VXX).
When purchasing an ETN, it is a good idea to ask yourself if you would be willing to lend money to the ETN provider and to look at the provider’s credit rating.

Sample Testing of ETF and ETN
Now we will look at the recent performance of a few ETFs and an ETN, and observe how well they meet their objectives. Each plot is the percentage move of the ETF against its associated index.
The first chart is shows the most popular ETF, SPY, which track the S&P 500 stock index. It is clear that it does a very good job. There is very little deviation of SPY from SPX. This is due to the very high liquidity of the product, the ease with which the fund is able to purchase the stocks that comprise the index, and the fact that no derivatives are needed.
The next chart shows the ProShares UltraPro Dow30 (UDOW) which seeks to achieve triple the daily performance of the Dow Jones 30 Industrial Average. Because this leveraged ETF must make use of derivatives to achieve this goal, returns over periods other than one day will likely differ in amount and possibly direction from the target return for the same period.

Volatile periods of the year can exacerbate this situation.
Notice that the UDOW does exhibit amplified moves throughout the year, going up more significantly and going down more significantly than the DOW, but by the end of the year when the DOW was up just over 4%, the UDOW was up by just only 5%. This longer term difference is due to tracking errors and fees.
If you are going to trade instruments like this, then it would make sense to monitor its daily price movement.
Inverse ETF
This graphic shows an example of an inverse ETF. SH tracks the inverse of the daily movement of the S&P 500 Stock Index. The chart clearly shows this inverse relationship. As the S&P 500 goes down, SH goes up by approximately an equal amount, and vice versa.

This fund allows the investor to take advantage of declining stock prices, and is a good candidate for cash accounts, IRAs, or other accounts that do not allow shorting. Notice that SH does a fairly good job of tracking the inverse of the S&P, but after one year with the S&P is up 3% for the year, SH is down 11%. Again this is due to tracking errors and management fees.
Next let’s look at a commodity, USO, the United States Oil Fund ETF which seeks to track the crude oil commodity.

This ETF invests in futures contracts which need to be rolled over each month, and the associated cost to carry and managements fees place a drag on the performance. Notice that the ETF does a good job tracking the commodity, but overall performance continues to slip each month.
It never exceeds the performance of the commodity itself, and by the end of one year when oil is down a net 15%, the ETF is down a net 19%.
Tracking CBOE-VIX
Finally, let’s look at a very interesting ETN, VXX, which is a specialty fund that attempts to track the Chicago Board Options Exchange (CBOE) Volatility Index (VIX), which is a measure of the market expectation of future volatility implied by the S&P 500 stock index.

Although this sounds like a rather esoteric instrument to trade, it is actually very popular “stock” that trades over 50 million shares a day with a market cap over $1.7 billion and has very active options contracts.
Investors trade this ETN to profit from movements in market volatility. Figure 5 shows that the overall price action of VXX does have a general correlation to the VIX, but it is not perfect. Due to the complex nature of the construction of this product, some days do not track as closely as desired. In fact, there are some days where the VIX goes up, and VXX goes down, and by the end of the year, the VIX was up 22%, and VXX was down 12%!
Although traders can and do profit from trading VXX and its options contracts, they need to be aware that there is a very large drag on this ETN.
Great Opportunities Await For ETF Traders
The lesson to learn from this brief introduction to exchange traded products is that ETFs and ETNs offer traders and investors enormous opportunities to easily diversify their portfolios and participate in many new markets by trading products that look like stocks.
However, since ETFs are products constructed from stocks, bonds, futures, currencies, and options, or backed only by unsecured debt in the case of ETNs, it is important to understand how these products are constructed, be aware of the financial health of the fund provider, and to follow the often repeated advice to read the prospectus carefully.
Let Netpicks ETF Investor Simplify ETF Trading
The NetPicks ETF Investor strives to teach you how to empower yourself to manage your long-term portfolio. Using low cost Exchange Traded Funds, and allocating your capital to the best sectors is the objective.
Nobody has more of an interest in your future than you do so why leave it in the hands of someone who gets paid even if you have negative returns?
The truth is that you can do a better job at managing your money than the “professionals”.
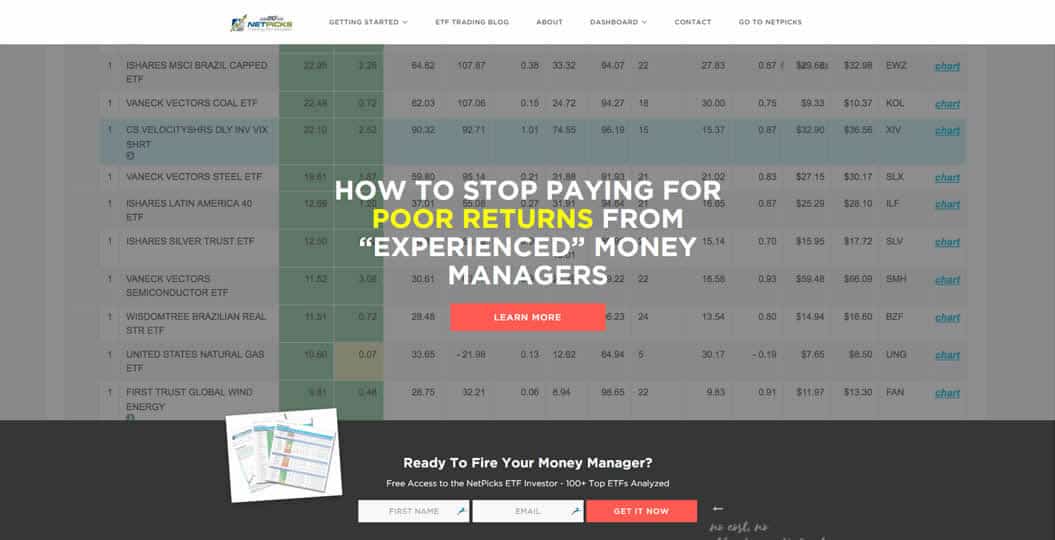
You can visit the Netpicks ETF Investor here, enter your email address, and get on the road to taking your future into your own hands. –