- November 30, 2019
- Posted by: CoachShane
- Category: Trading Article

The foundation for the Darvas Box strategy started when Darvas, using only price action and volume, used it for trading stocks starting with M&M Woodworking. What he didn’t know was that the increase in price was happening because of merger rumors that were circulating.
Darvas paid no attention to the rumors.
In this post, you will learn:
- The origin of the Darvas Box method
- The theory behind it
- Complete Darvas Box trading strategy
Let’s continue…..
The price action and volume were all he was using to buy the stock. In the end, he sold out 2 points before the high and before the merger was announced.
He simply bought an upward moving stock using his Box theory- trading with the trend of the stock (trend following).
Latching on to his last success, Darvas bought into another fast-moving stock that was climbing in price. This time, it turned out that simply buying something that was moving up wasn’t a great play and he lost $2000.
It was a loss that concerned him for a few reasons:
- It was the best performing stock at the time
- Price reversed back to the upside soon after he took the loss (we know that feeling)
- Turns out, he bought the top of the stock
Darvas dove into hundreds of stock charts and learned about the movement of price in each stock. In doing so, patterns began to emerge.
He found that stocks once in motion, tend to stay in motion and do so in a series of frames.
It’s not much different than the resistance level breakouts that some traders use today. But just like today, trading breakouts without some type of volatility measure usually does not end very well.
As well, you want to see some type of increasing activity before the breakout and not just buy on the expectations of a breakout.
Darvas Box Theory
Darvas bought an aviation stock thinking it was about to break the high of one box and lead into another. He bought, the stock turned around and wiped out the profits from the previous three trades ($2400).
From these experiences, Darvis laid out some objectives in approaching the markets. The theory was that by buying stocks at new highs, the boxes gave entry points and stop-loss locations.
The goals?
- Right stocks
- Right timing
- Small losses
- Big Winners
To achieve these goals, Darvas wrote out what he would use to achieve this plan he had:
- Price and volume
- His Darvas Box theory
- Automatic buy stop orders – orders to enter the market above current price
- Automatic stop-loss orders – order to exit the trade below the current price
- Entry and exits came from the box setup
Darvas Box Trading Strategy
The trading strategy for the Darvis Box looks like this:
- Trade breakouts from the box in the direction of the trend
- Trail his stop loss which will protect his open profit as price trends higher
- Buy more as the trend continued to move upwards
- Take his profits or cut his losses when the trend reversed
This does not include the stock selection process or what type of volatility measure to use to give you the odds that the breakout has the potential to succeed.
Most often in the stock market, the volume would be used but you will have to determine the type of volume you need to see.
You may want to test such things as an increase in volume that exceeds the 20 period average of the previous day’s volume.

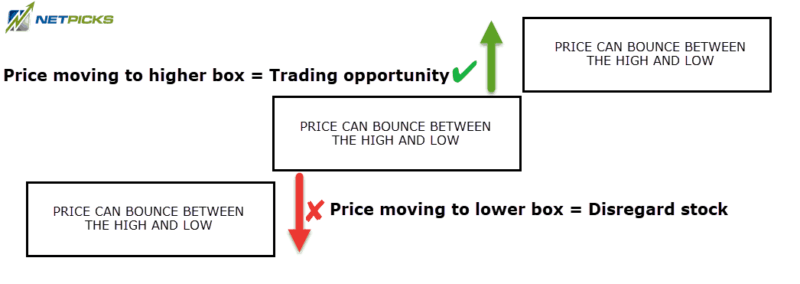
- When a stock fails to make a new high for three days, the most recent high that is higher than the three subsequent highs becomes the box top.
- When a stock fails to make new lows after three days, the most recent low that is lower than the three subsequent lows becomes the box bottom. (We are using the low after the high is formed)
Once the bottom breaks in an uptrend, the stock would be taken off the list until a new box forms.
A break of the top would indicate a trading opportunity.
Here is a recent example of the stock Johnson and Johnson

- This box is well-formed but price dips to the downside and a gap up and over the top of the box (you will need to rule base what to do with gaps)
- A new box forms and the green arrow points to the breakout of the stock above the box.
- Trade is held for 24 days and ends with a break below the box +2.53% gain or $125.38 profit per share
Losing Darvas Box Method Trade

- Using a buy stop order at the break of the box, the trade is entered
- While in the current trade, a new box forms following the 3 day high/low rule – still in trade
- Price breaks the box lows and exit at next candlestick open – 2.72% loss or $135 per share
Please keep in mind that the breakouts shown were not backed up by a volume study. The results could be different if there was a measurement made of the strength of the breakout.
Darvas Box Strategy – Breakouts From Consolidation
If you are reading this and thinking this is a breakout strategy, you’d be correct. The difference between the Darvas Box and the way the majority trade breakouts, is there are rules in regards to how the box forms.
Darvas would look for highs in the price and whether that was 52-week highs, 100-day highs or all-time highs, it doesn’t really say in his book. He would also scan for stocks that were primed for growth which back in his day could have been a wide variety of stocks.
Darvas would also consider volume to assist in determining if a breakout could be sustained.
Can this be a valid approach in other markets or without the added criteria of volume and instrument selection?
There is no question that this is a trend following trading strategy that will get chopped up in consolidated environments (perhaps using a 3-day buffer was Darvas was of avoiding that). Breakout trading is a good strategy when combined with other criteria and the ability to cut losses when the breakouts fail.
This is a rudimentary backtest of stocks of the S&P 100 that spans 6744 bars of data. Looks promising and this is without stock selection, volume measures or tested stops, profit taking or entries that could perform better without over-optimizing the backtest.

In the end, it is up for every trader to test any trading strategy that they are interested in. The Darvas Box trading strategy goes back decades but the key idea is that it is a strategy complete with trading rules including where and when to enter.
There are unanswered questions with the Darvas strategy – including which highs to use – and you will have to determine what the best measure of increased strength is to allow for a higher probability breakout trade.
Wrap-Up
The Darvas Box method is a systematic way of trading breakouts from ranges.
When the box sets up, you know the exact entry price you will take a trade at as well as your exit price. There are more exact ways to play breakouts, shown in this article about trading range breakouts.
This is a great start method for traders but ensure you hold to your exits when they occur.
