- May 16, 2015
- Posted by: CoachShane
- Category: Trading Article

In the post called Recognizing the Potential of Chart Patterns, I tried to illustrate the importance of how a chart pattern is configured and which direction you should be looking for the market to move in next.
There’s another important concept I want to elaborate on from my original post about When do Candlestick Patterns Really Work? It’s what you see next following the formation of any pattern – it’s the “if, then, else” chart pattern logic.
Logic Of Chart Patterns
Again, we should start off with a recap of what I stated on this aspect of chart patterns in the original post: –
“Once a pattern does form and you take your trade, you must know what you want to subsequently see. If you see a break of the head and shoulders neckline for example and strong buying meets it, the chances then are elevated that you’ll see at least a test of the right shoulder area. This is because with a break of the neckline, the expectation is that there is a strong probability of long liquidation entering the market. Knowing this can give you an edge even when the pattern fails.”
Exploring this further, there are key references prices created by the pattern, which can give a trader a much better idea of whether or not the pattern is likely to complete.
In the example of the head and shoulders pattern, these are the initial swing low after the break, the neckline and the right shoulder high.

A retest of the neckline that holds, followed by more selling and a break of the initial low, gives this pattern a much higher chance of completing. While a poke back through the neckline definitely isn’t a good thing for a seller of this pattern, it doesn’t necessarily mean that the pattern has completely failed so long as it fails to hold above the neckline for very long.
A swing back though the neckline followed by a bounce when it retests the neckline from above and the pattern is seriously under threat. If price breaks above the right shoulder, then the pattern is likely dead.
You can start to see that what happens next has the potential to change what’s more likely to happen. Additionally, the location that you take your entry and place your stop can be crucial – to see the pattern out completely can require more than you think in terms of the size of a stop and so sizing your position properly can be crucial.
Chart Pattern Failure
The issue is that the eye is always drawn to patterns that have worked on a historical chart. But if you look more closely, you’ll see that there are many potential patterns which ended up failing. This is because failed patterns frequently do the opposite to what is expected and therefore end up looking completely different at first glance.
So it’s important to understand how patterns should behave as they develop and the key reference prices that need to hold. In the very simplest form, we can start to understand this in terms of swing logic – i.e. higher highs, lower lows, lower highs, higher lows.
For a pattern you also need to reference the breakout point, but let’s consider this basic logic for now.

We can see that in terms of the initial swing high, the next major high as it looks at this point is a lower high. So the possibility of a reversal begins to increase in probability.
It should be noted in this chart however, that the thrust higher preceding the first swing high is likely to mean a follow through of some kind. But the fact is that a lower low after the lower high would increase the chances of a reversal. In this particular scenario, the lower high is really not confirmed yet.
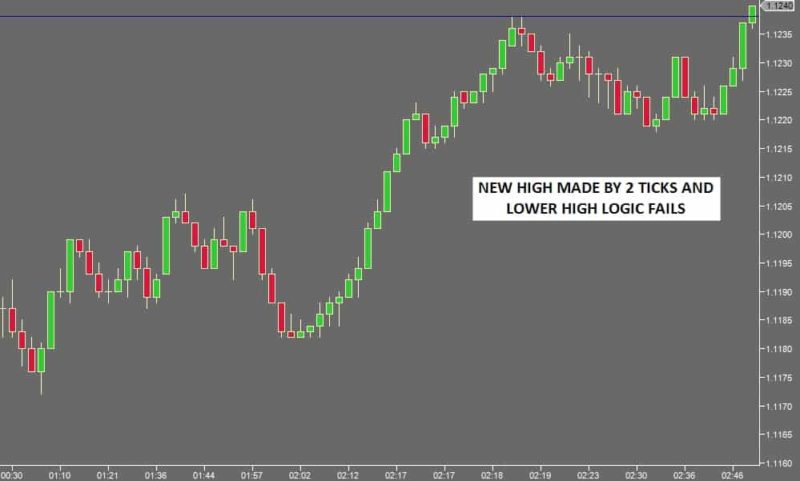
What happened here was that there was no lower low and the first swing high was broken by a couple of ticks.
The same sort of logic then starts to apply to the opposite side of the move – the market needs to hold at least the major swing low of the series in question in order for there more upside to be the likely outcome.

1 Comment
Comments are closed.
I’m very impressed by the detail of your blog posts. This is very helpful content. Thanks for sharing your thoughts.
Stock tips